Part 1: Laying out foundations for multicloud and hybrid cloud financial governance
In this post, we discuss Cloud Economics. This is showcased on Microsoft Premier Developer Blog. We will focus on Cost Optimization which is the first pillar of the Microsoft Azure Well-Architected Framework. However, whenever possible, we will extract principles that apply to other Cloud Service Providers (CSP) such as Amazon Web Services (AWS) and Google Cloud Platform (GCP). The purpose is to cover today’s reality: many enterprises and organizations are entrenched in Multicloud and Hybrid Cloud architectures. Thus any unified and consolidated approach must encompass these cloud models.
I started my journey as Chief Information Officer (CIO) of Structube, a medium-sized furniture retailer in Canada. An all Microsoft shop with a traditional On-Premise datacenter, the natural choice for a cloud service provider is Microsoft Azure. However, like any fast growing company with relatively autonomous departments, as much as one would like to stick to a single strategic cloud provider or technology stack, inevitably, others creep in.
In any such environment, with multiple technology stacks, operating systems, and devices to manage and support, Information Technology (IT) governance is challenging to say the least. The same is true for financial aspects of IT governance (i.e. financial governance).
With the advent of cloud, terms such as commoditization have been used. While we are not interested in the polemic of whether computing has become a commodity akin to electricity, oil, gold, or wheat, we are distinctly aware that we are charged computing consumption at precise and predictable hourly rates (see Azure Pricing Calculator, Google Cloud Pricing Calculator, and AWS Pricing Calculator). Furthermore, new cloud pricing models have emerged such as reservations (see Reservations, Reserved Instances, Committed Use Discounts), spot pricing (see Azure Spot Virtual Machines, EC2 Spot Instances, Preemptible Virtual Machines), etc. In addition, CSPs offer a variety of controls, including usage quotas, budget alerts, and organizational permissions.
In this article, we will explore how to track costs from these 3 cloud service providers. We will also carve out a strategy to estimate on-premise costs. Bear in mind that on-premise cost estimations tend to be less precise (and/or accurate) and can vary greatly from one enterprise or organization to another. Tracking costs both in the cloud and on-premise in a uniform view is key: it enables us to perform cost estimation and optimization for all our workloads. This includes on-premise workloads, cloud workloads, hybrid workloads as well as workloads between clouds (i.e. intercloud workloads).
Before we dive into the details, I highly recommend listening to Adam Ronthal’s webinar “The Future of Data & Analytics is in the Cloud“. Adam Ronthal is VP Analyst at Gartner and has published many articles and webinars on financial governance for cloud among other topics. One of many key takeaways of his presentation is that the key metric you want to look at when doing cost optimization is the Price-Performance ratio.
The Comprehensive Cost Dashboard
A work in progress…
The scenario: DevOps ABCs is an organization with cloud footprint in Azure (7 active subscriptions), GCP (2 billing accounts), and AWS (a single account). On September 1st 2018, it has purchased 2 physical servers: Windows Server A (with Microsoft SQL Server) and Linux Server A (with a MySQL Server). Both are hosted on-premises. The Windows Server A is amortized over 5 years while the Linux Server A is amortized over 3 years.
For the reader who wants to jump straight to the highlights of the dashboard, head here.
Also, if you wish to jump straight to the following implementations, please feel free to do so
For those wondering “Why should I care?“
For the brave souls, please continue on…
Implementation of the Cost Dashboard
Microsoft Azure
Here is a full hierarchy of the Azure Management Groups:
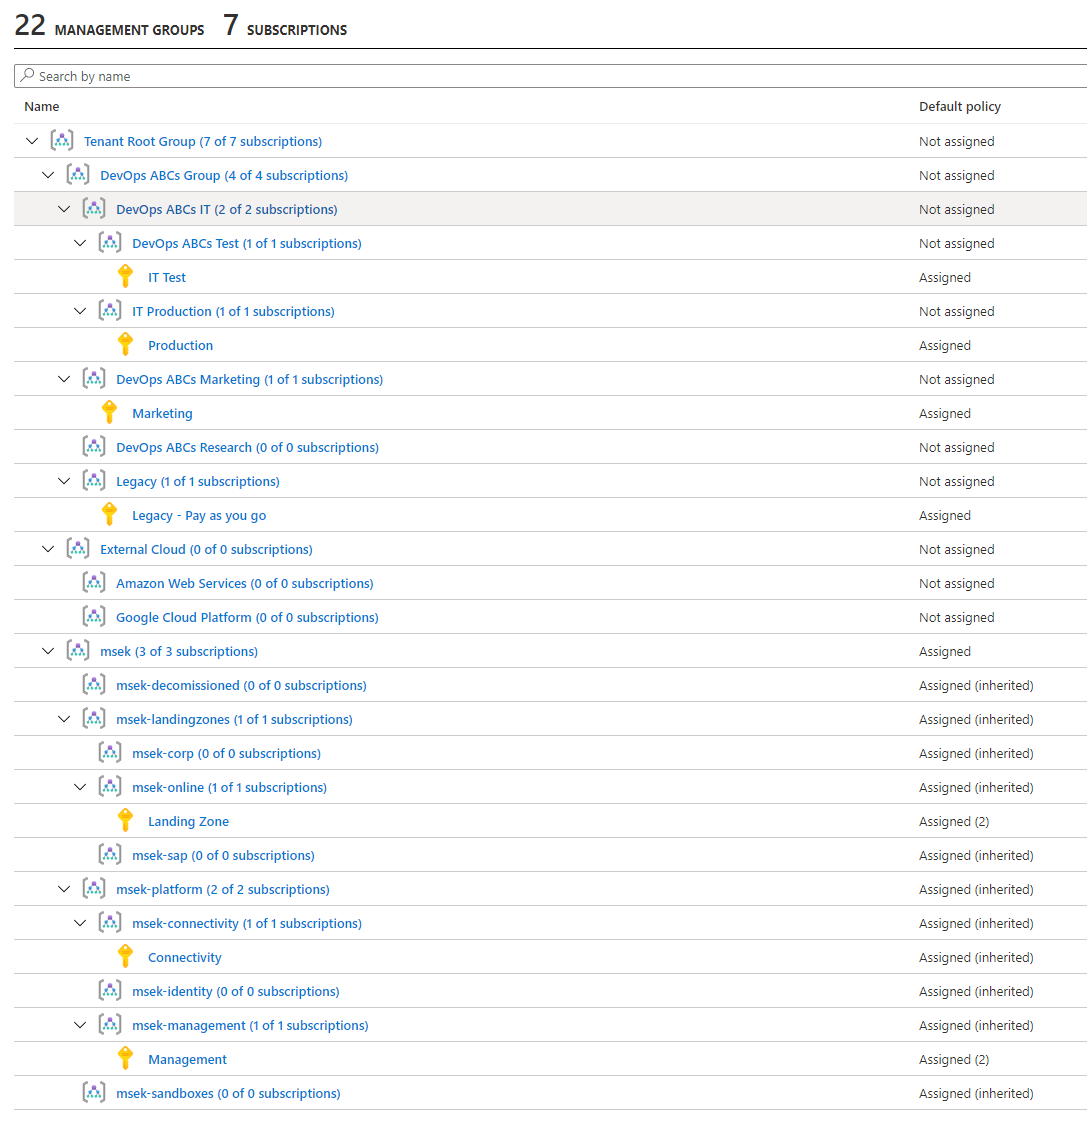
There are 22 Management Groups containing a total of 7 subscriptions
We notice that some of these Management Groups come from the Enterprise-Scale – Reference Implementation in GitHub. Best practices for how to organize your Azure resources effectively is deferred to the Cloud Adoption Framework.
Guiding Principles
Of note with respect to costing, we adhere to the following two guiding principles:
- Resources that are dependent to each other and have the same lifecycle should belong to the same container (e.g. subscription or resource group). For instance, a web app with a database backend in a given environment (e.g. Dev, Test, or Production) should belong to the same resource group; in particular, if all 3 environments are used, we would require 3 resource groups, one for each environment.
- Shared resources that are used by multiple workloads should be placed in their own container. For instance, a network infrastructure (e.g. an Azure Virtual Network) used to Extend an on-premises network using VPN to Azure should be in its own resource group. Another example is a resource group that contains resources for a workload that collects monitoring data, cost data or DevOps metrics data across all resources in a cloud. Indeed, our Comprehensive Cost Dashboard depends on such a workload! (see Figure 2)
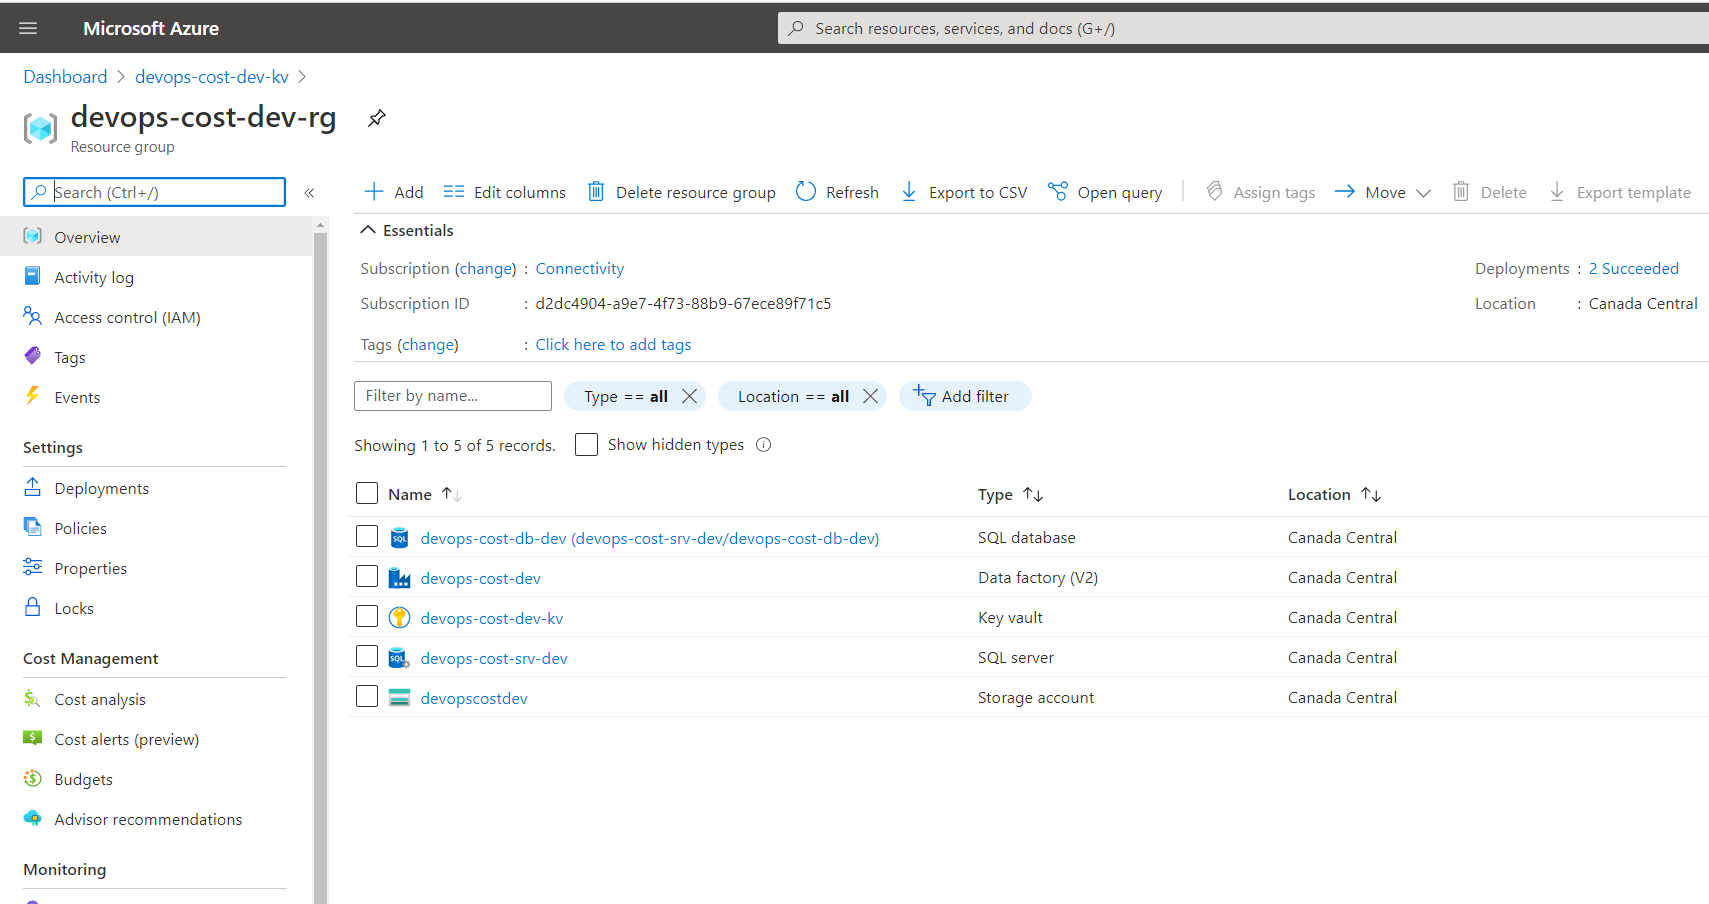
The Cost App Resource Group for the Dev Environment
Amazon Web Services
For cost management in AWS, we opted to monitor and control our AWS spending in Azure Cost Management. This can be done in a few minutes by following the documentation “Set up and configure AWS Cost and Usage report integration“. (see Figure 3)
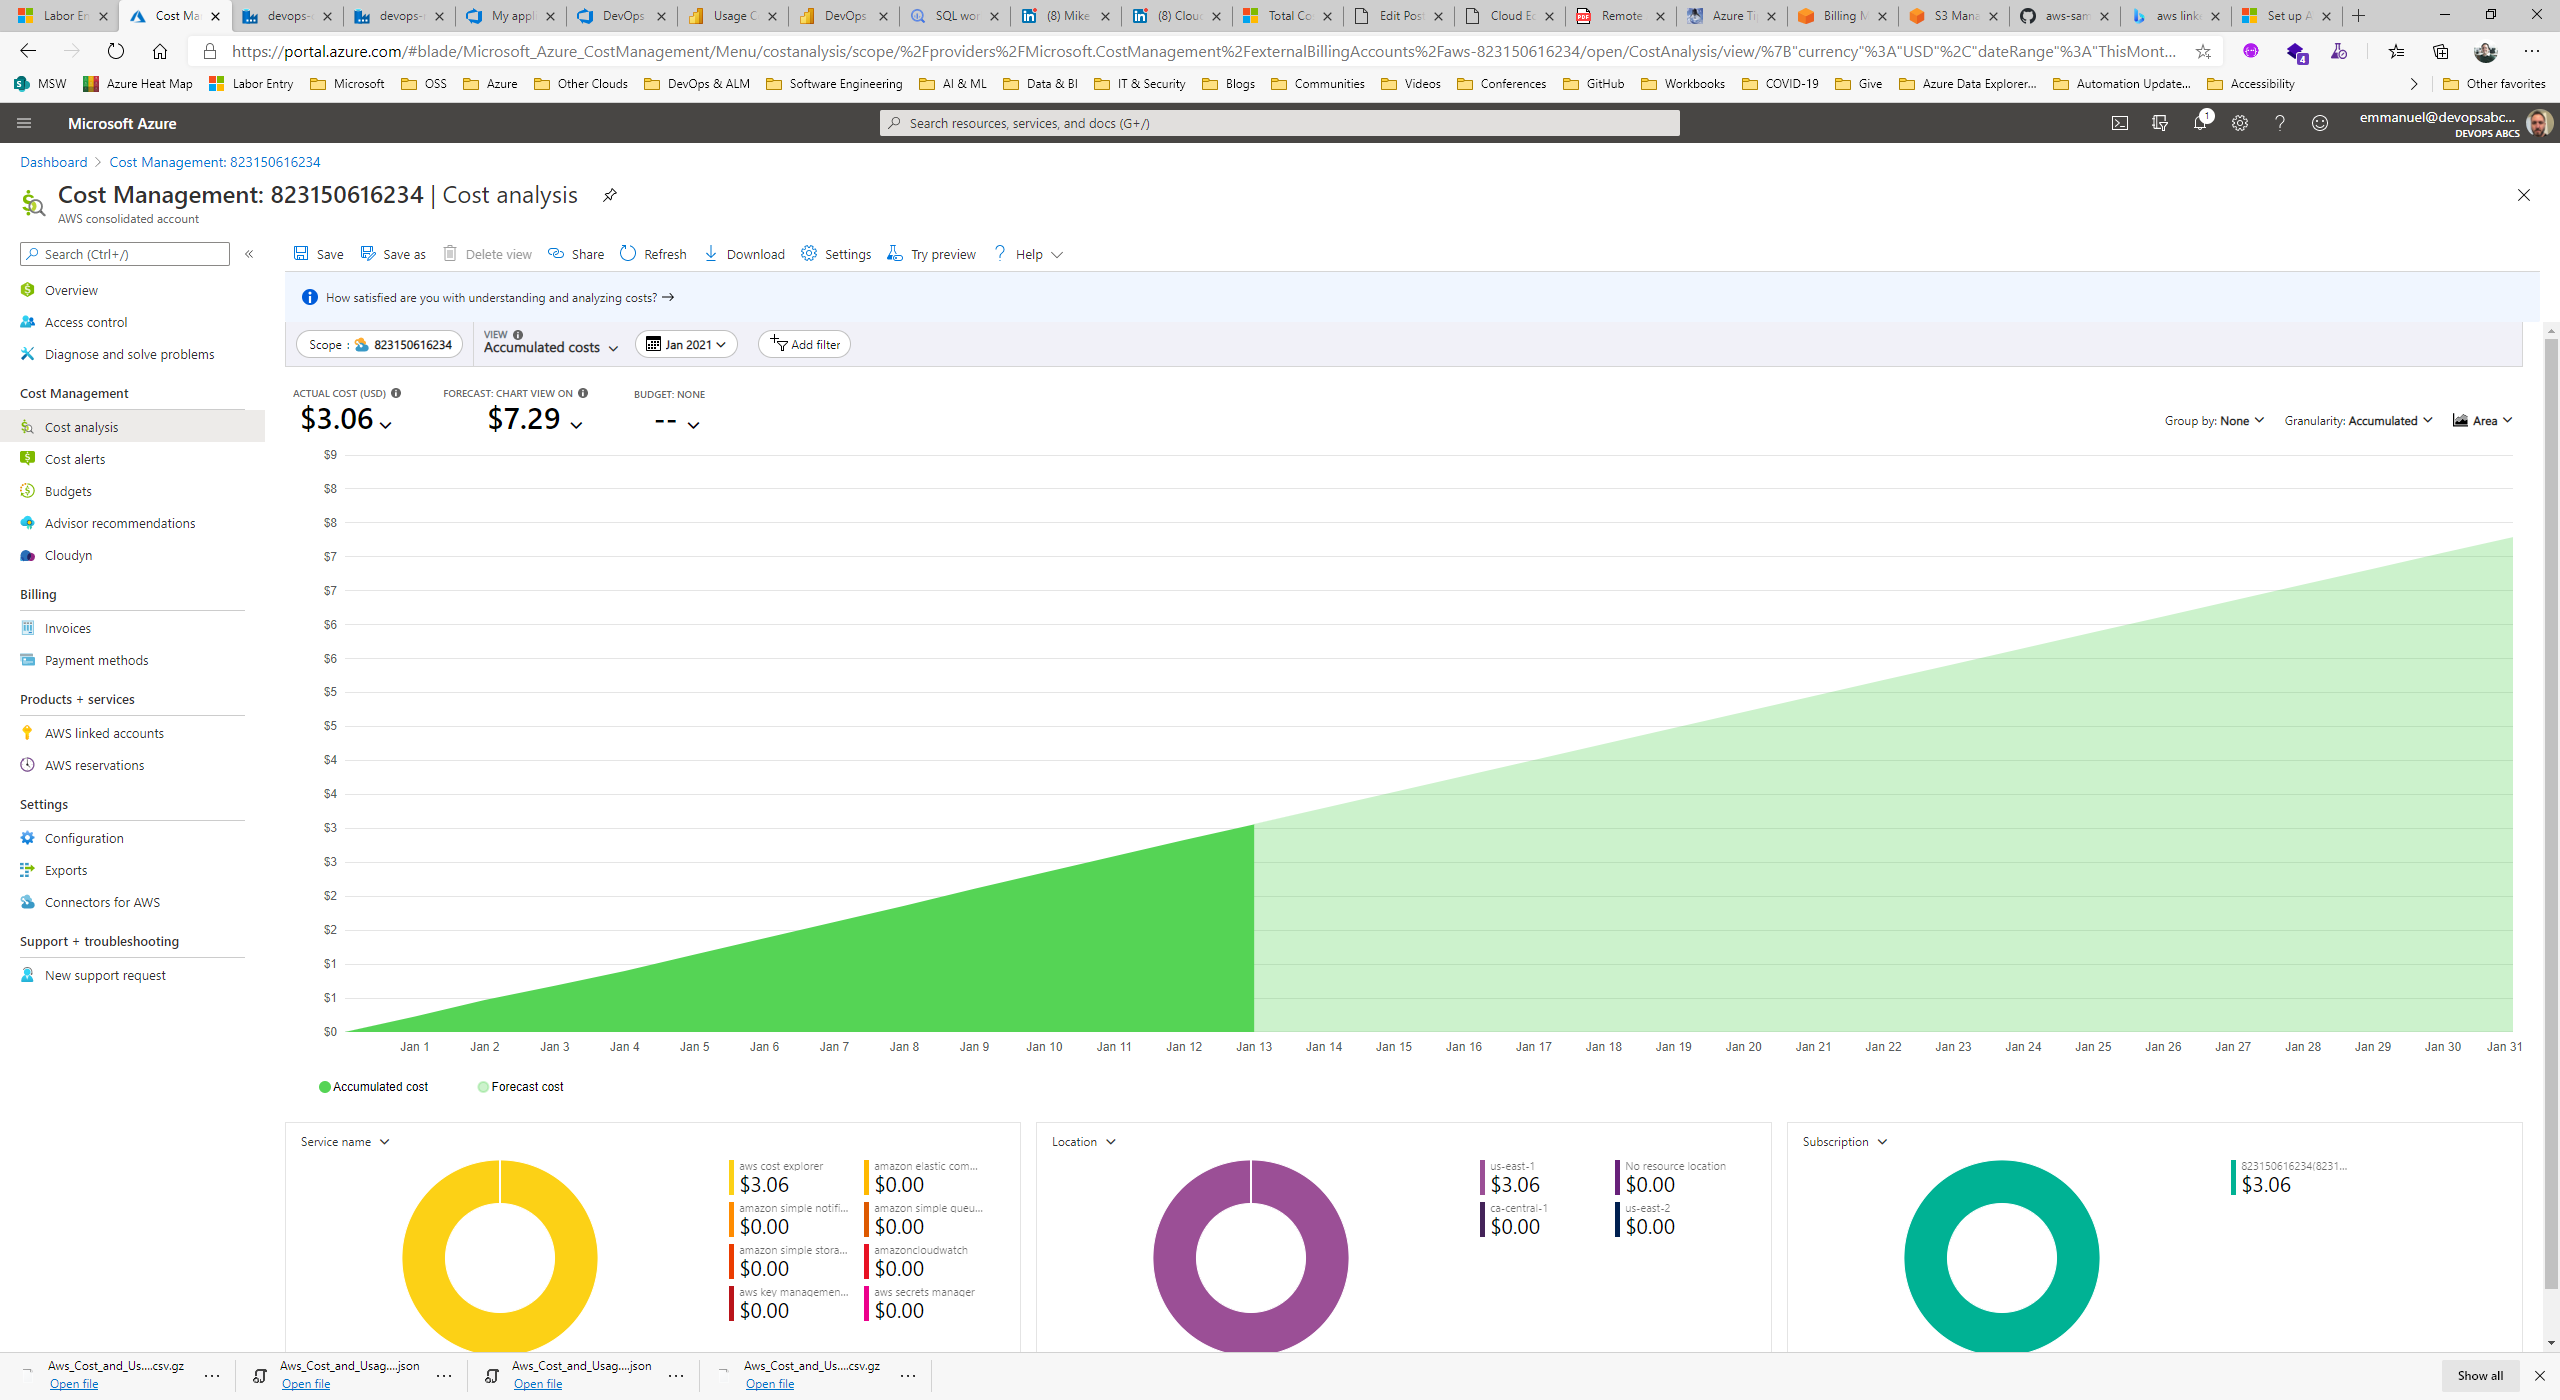
Monitoring AWS spending in Azure Cost Management
We are then able to use the same techniques to pull cost and usage data from AWS as the ones used to pull cost and usage data from Azure. While these techniques warrant a whole post on their own, we briefly mention that we are continuously pulling cost and usage data from the Azure Cost Management APIs orchestrated by a Data Factory. (see Figure 4)
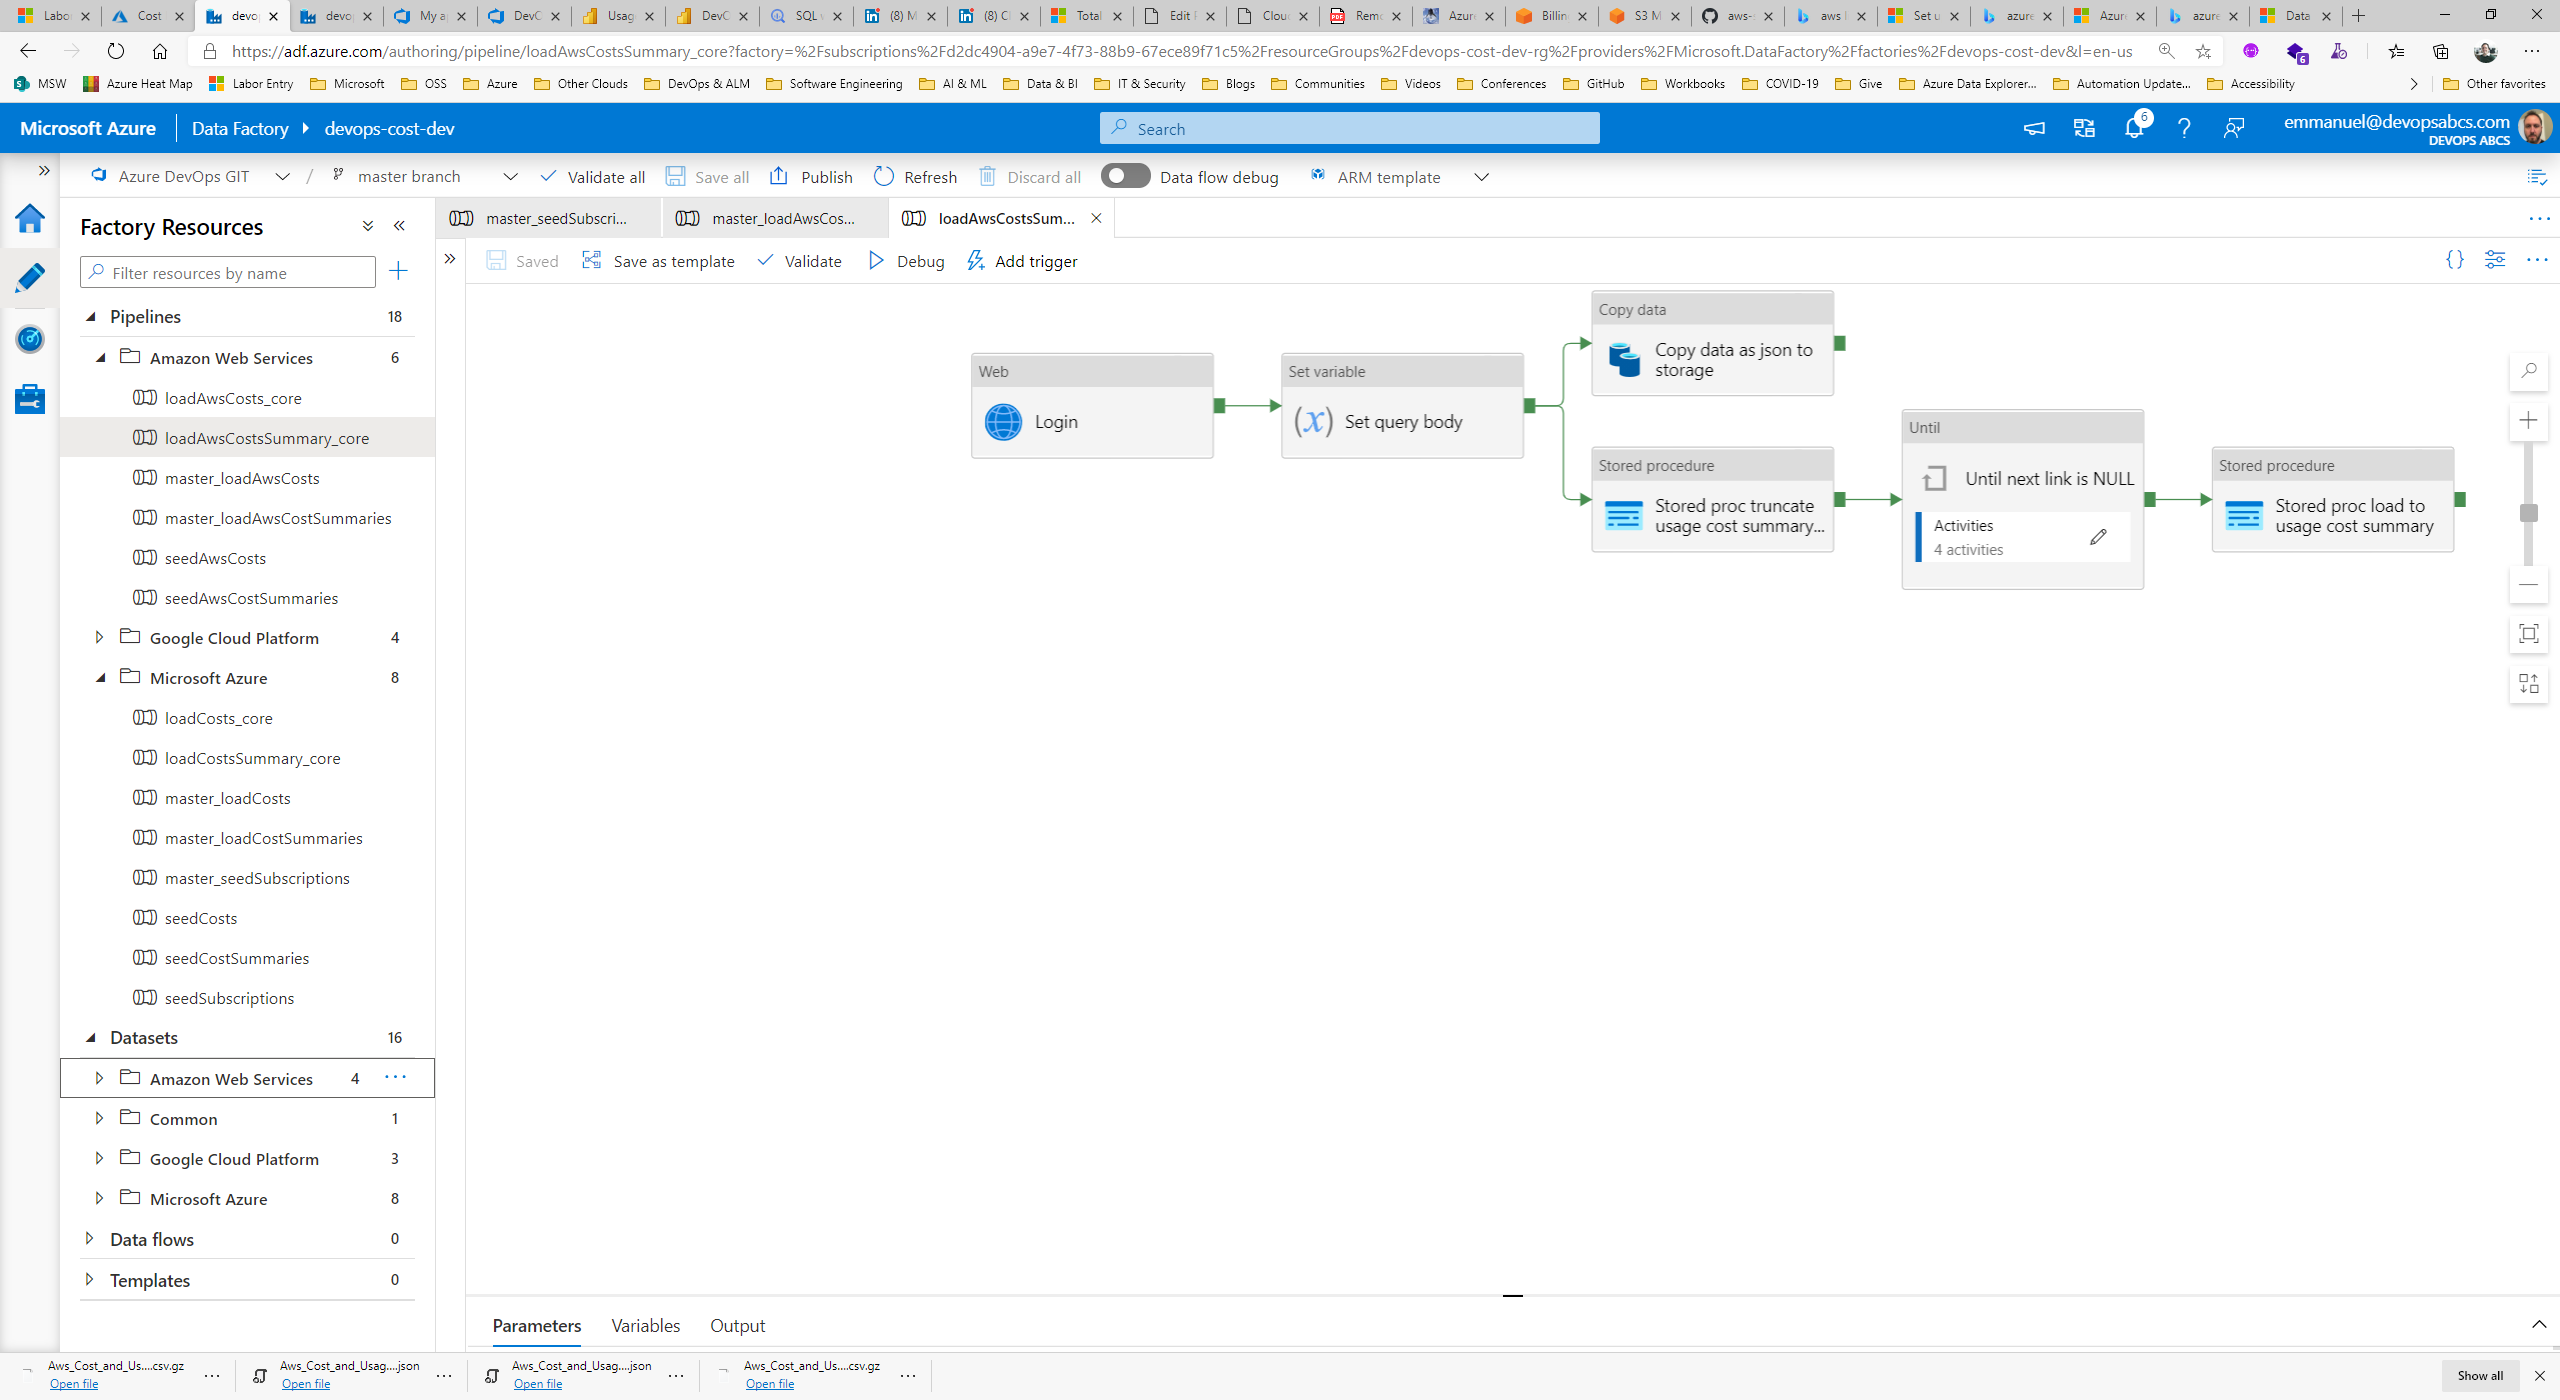
Data Factory used to consolidate cost and usage data from CSPs
Once AWS Cost and Usage Reports are enabled, cost and usage data is exported hourly (or daily or monthly) to an S3 bucket. (see Figure 5)
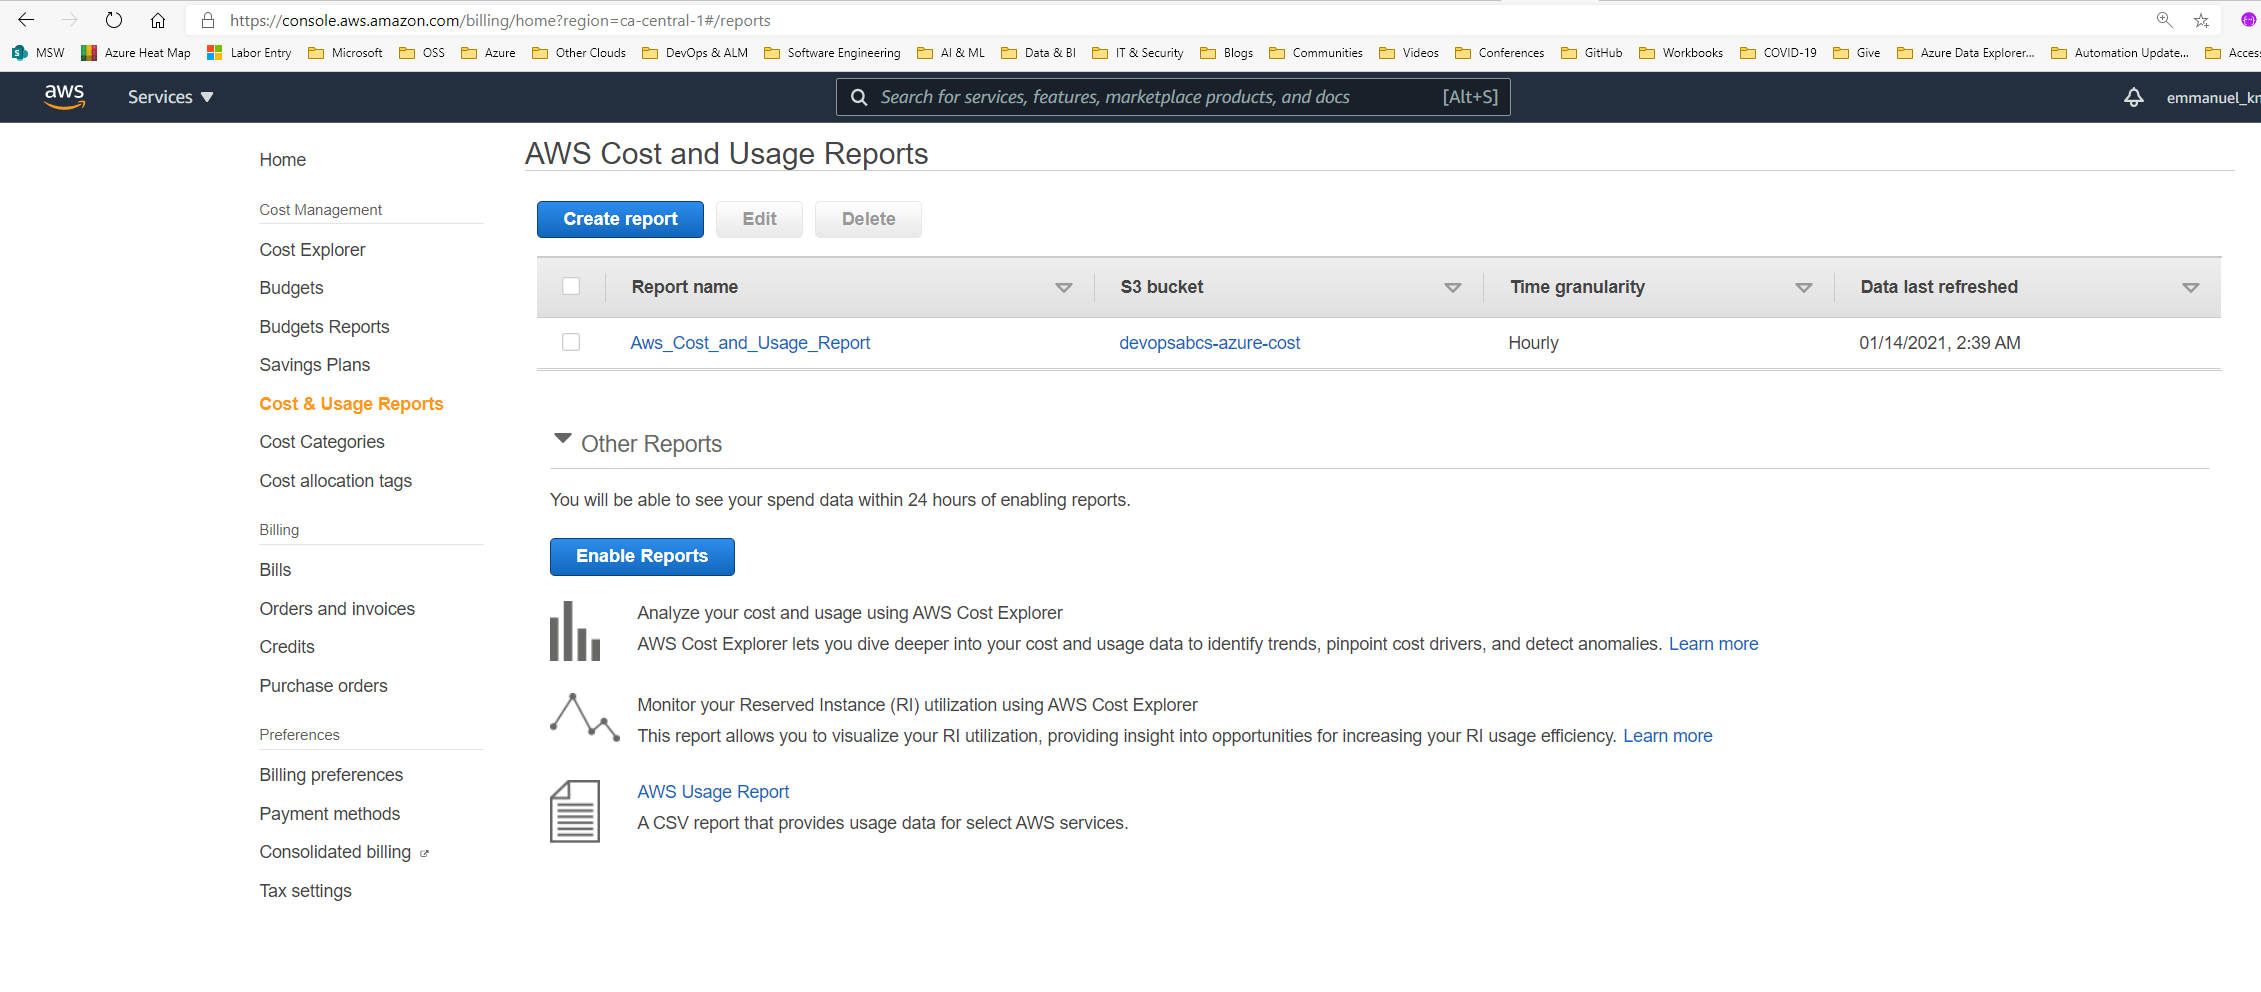
AWS Cost and Usage Reports enabled hourly
In AWS, we can divide up our bills by cost center or project by means of tagging, namely, by using cost allocation tags. Careful rigor and a thoughtful tagging strategy must be exercised to ensure all resources are tagged appropriately. We can then activate user-defined cost allocation tags. (see Figure 6)

Activating Cost allocation tags
In order to take advantage of the granularity provided by these cost allocation tags, we need to tap into the raw csv cost and usage data exported to the S3 bucket defined above (Figures 7 and 8). Alternatively, we can directly talk to the AWS Cost Explorer API as is done in this GitHub repository.
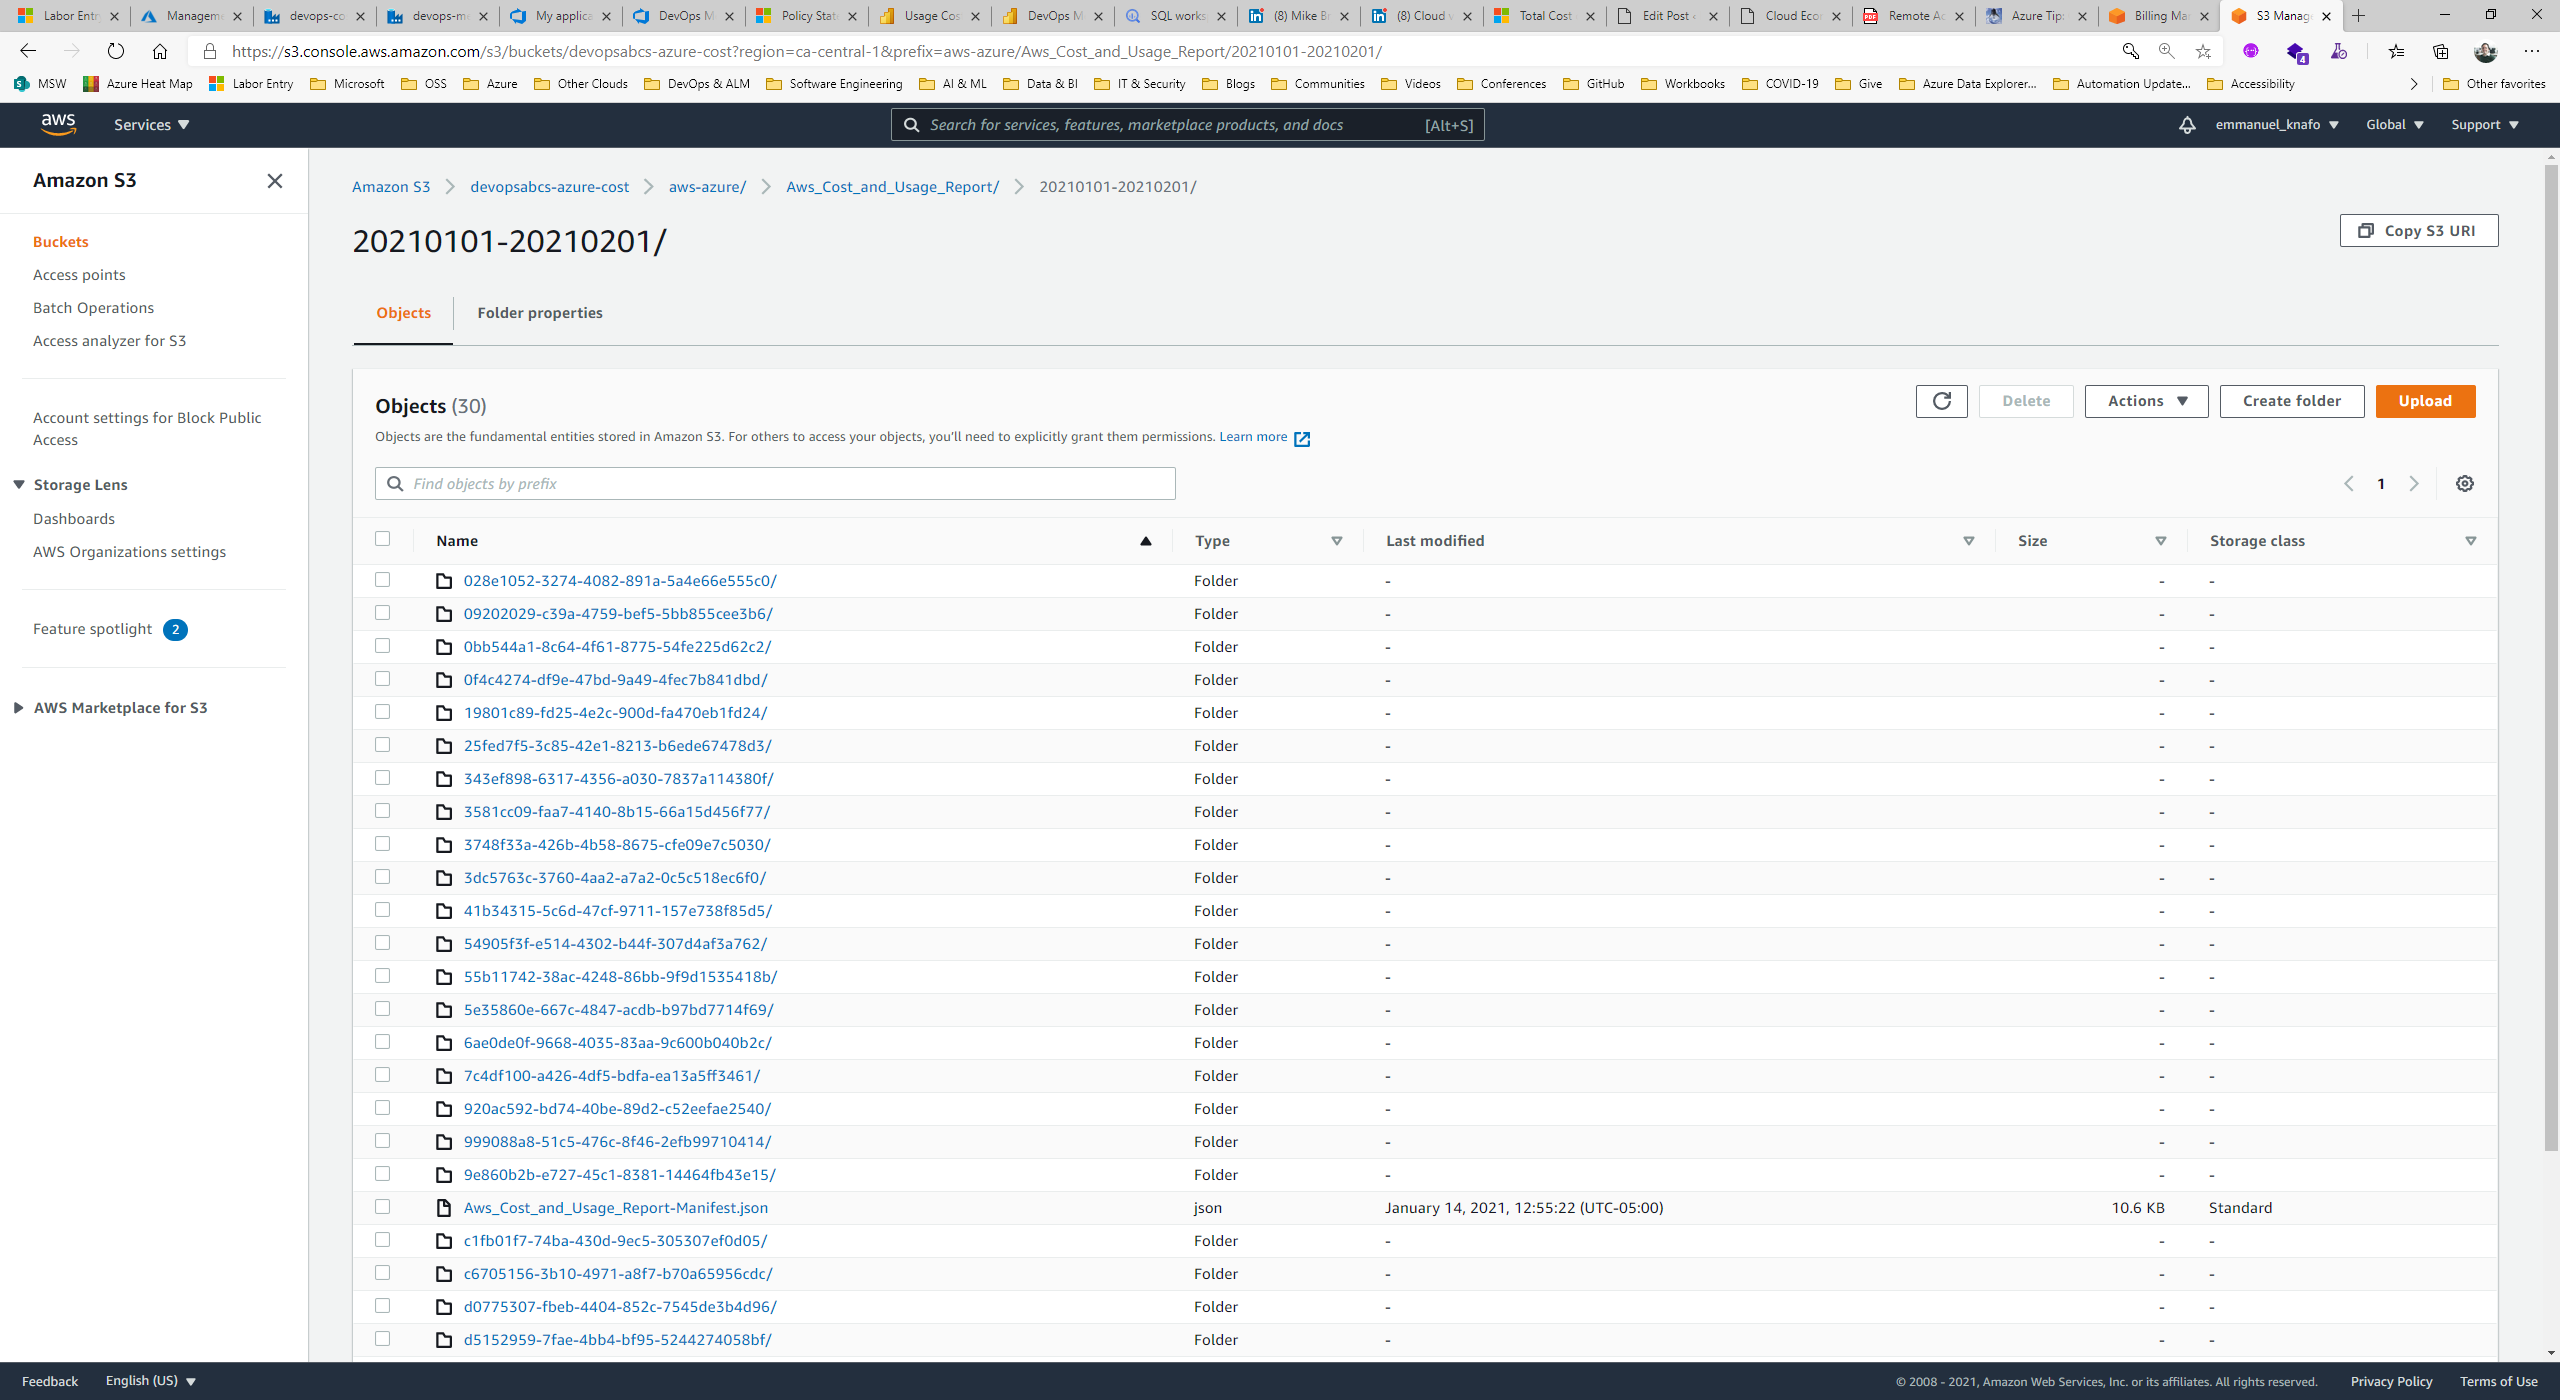
S3 Bucket containing raw csv cost and usage exported data
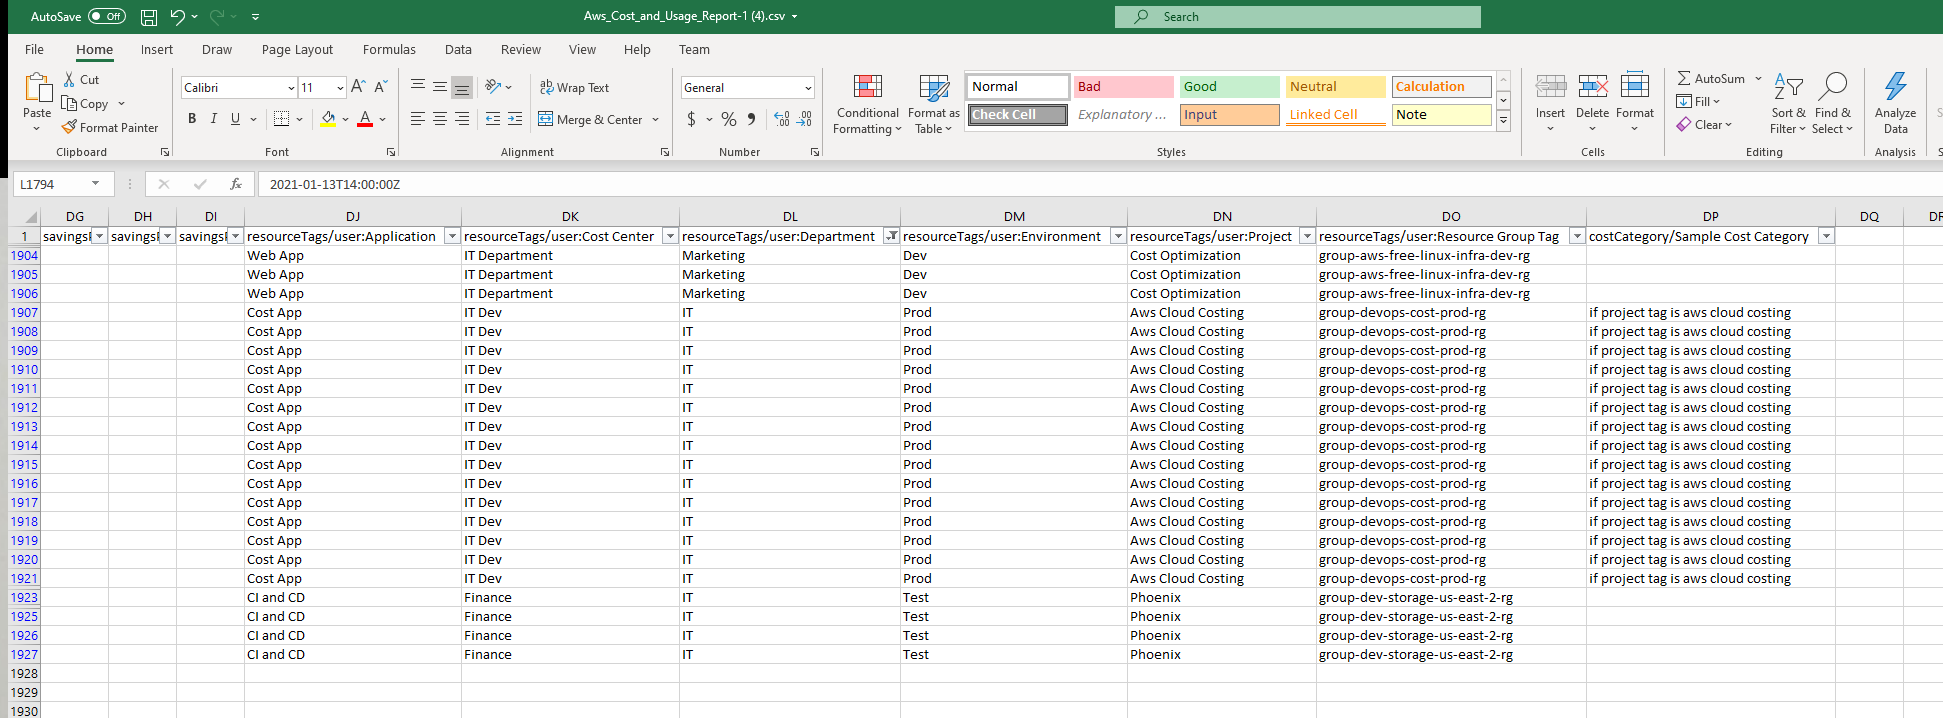
Sample cost and usage data containing user-defined cost allocation tags
Ultimately, warehousing the cost and usage data contained in the exported csv’s is our preferred approach. This is a great segue to our 3rd CSP which requires yet another technique.
Google Cloud Platform
GCP has deprecated Export Cloud Billing data to a file in favor of Export Cloud Billing data to BigQuery. The latter export method is much more flexible and captures a larger dataset.
With BigQuery export enabled as in Figure 9, we can query the billing export datasets (see Figure 10).
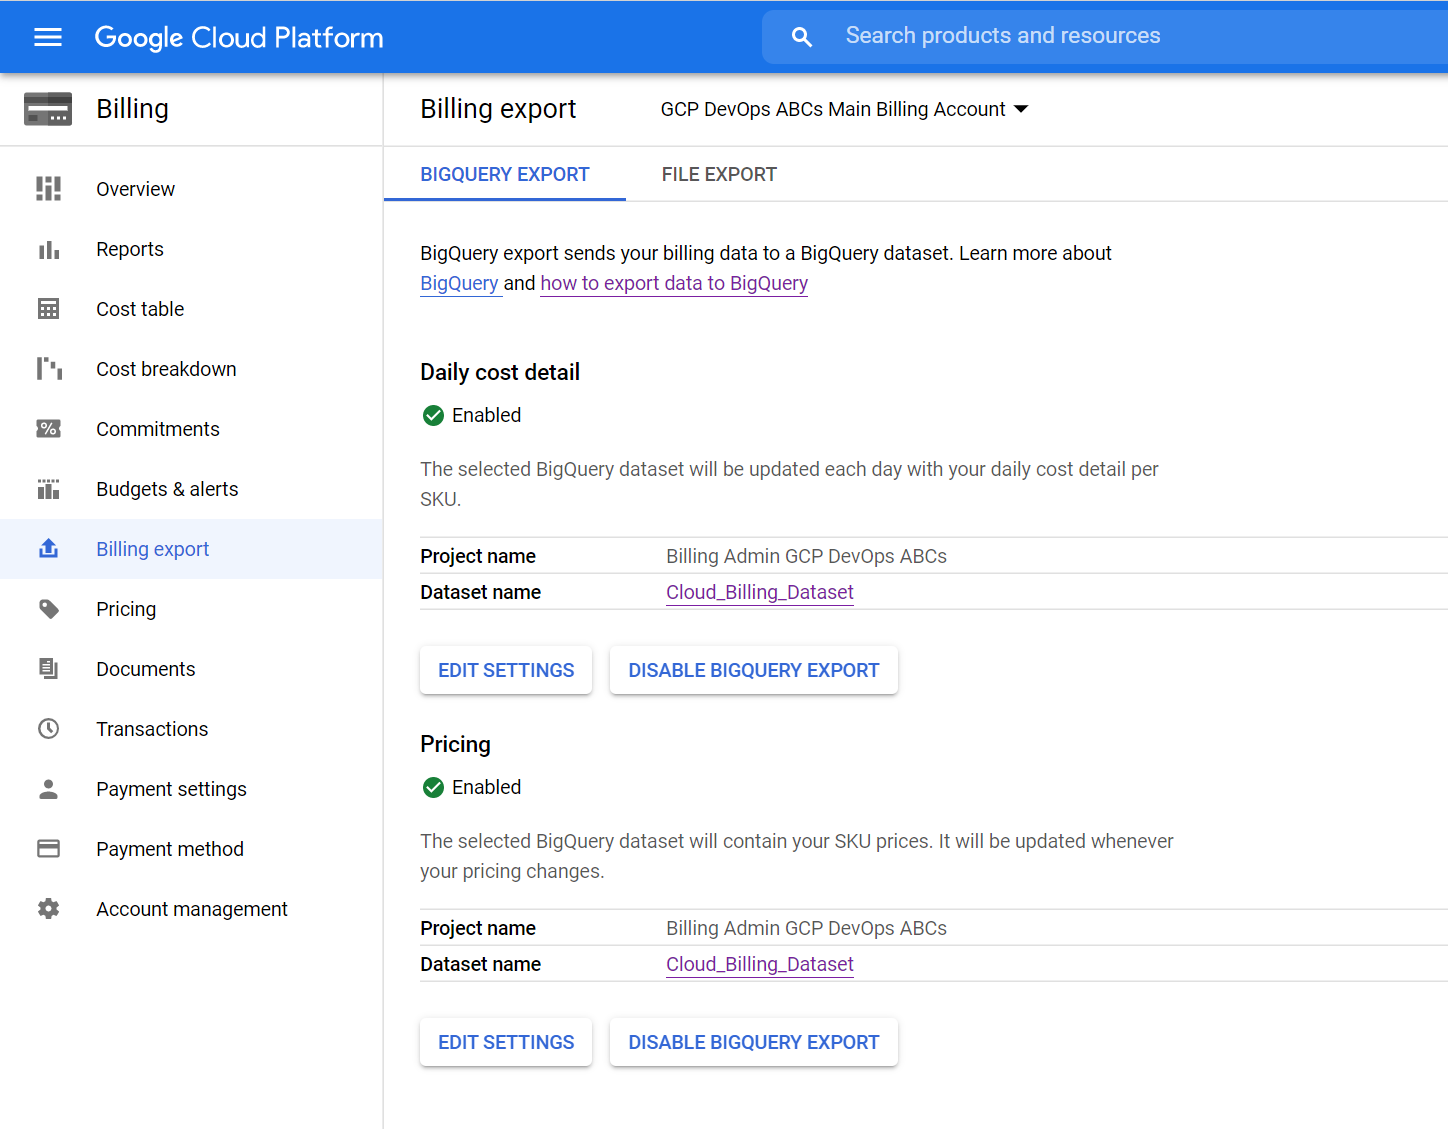
BigQuery export is enabled for Billing Account “GCP DevOps ABCs Main Billing Account”
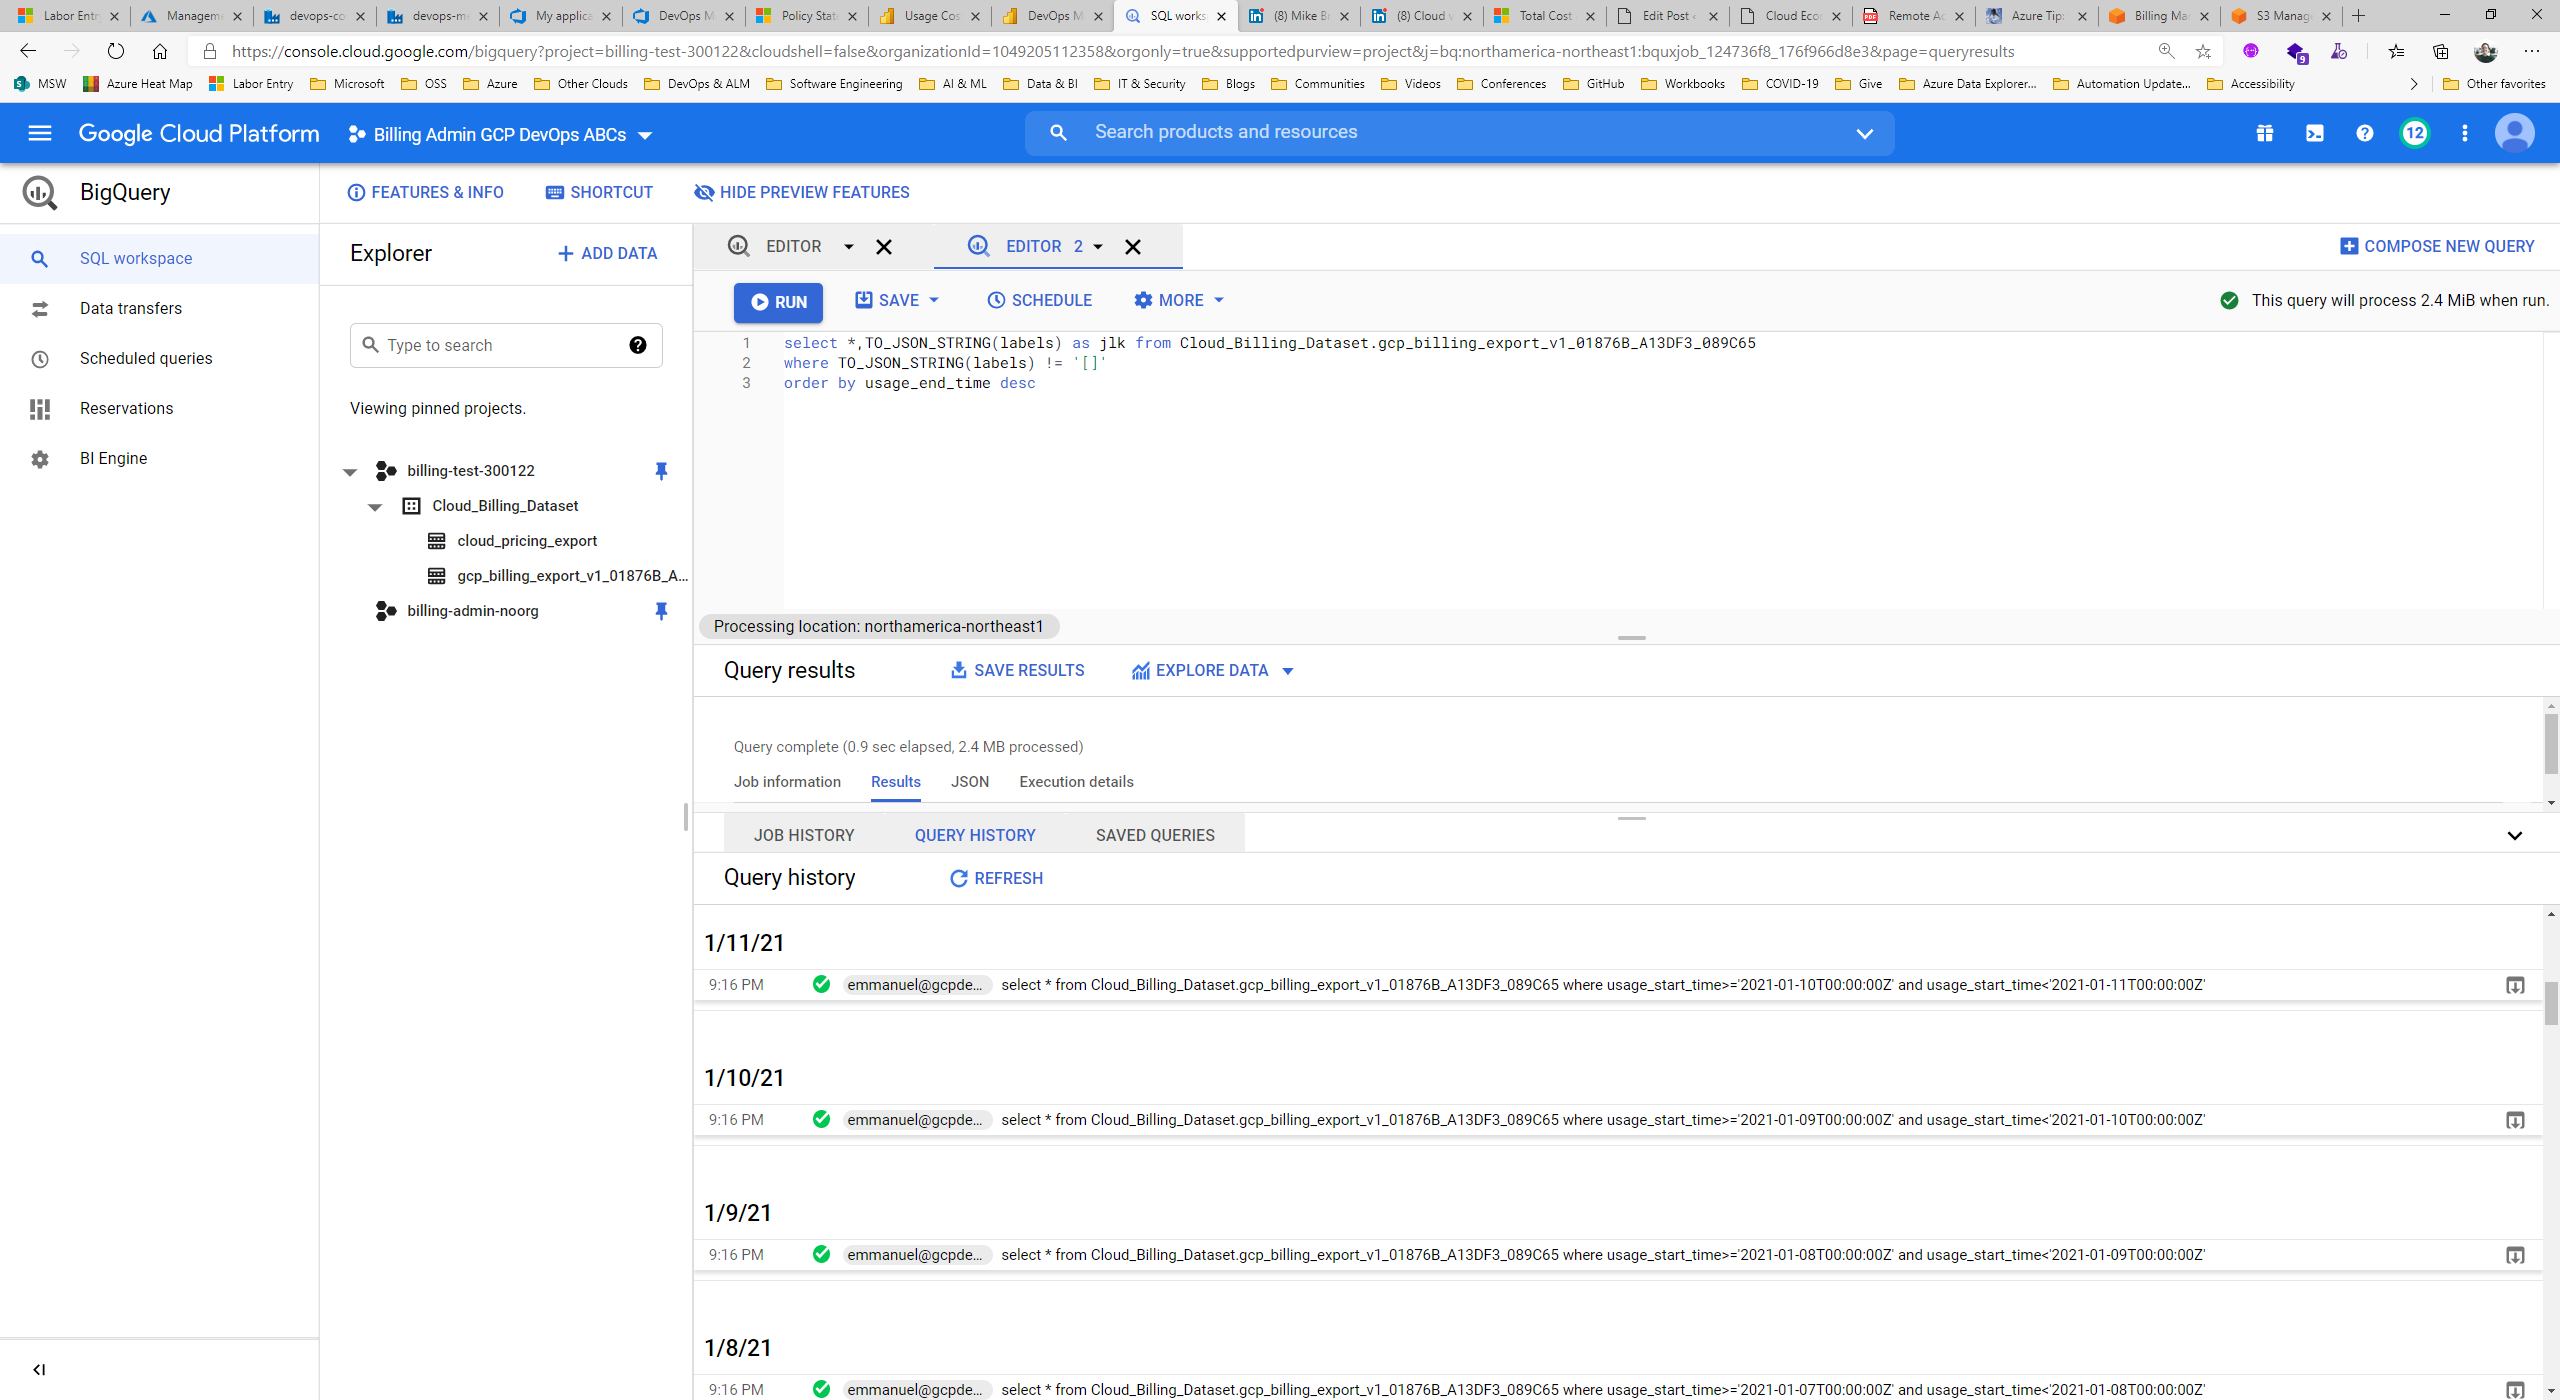
Querying the billing export datasets in BigQuery for centralized project “Billing Admin GCP DevOps ABCs”
A sample query that fetches a day’s worth of cost and usage data looks like
select * from Cloud_Billing_Dataset.gcp_billing_export_v1_01876B_A13DF3_089C65 where usage_start_time>='2021-01-12T00:00:00Z' and usage_start_time<'2021-01-13T00:00:00Z'The most effective way to divide up a bill is to break up resources into a Project Container. We defer this to Resource hierarchy. Our rather simple resource hierarchy is displayed in Figure 11.
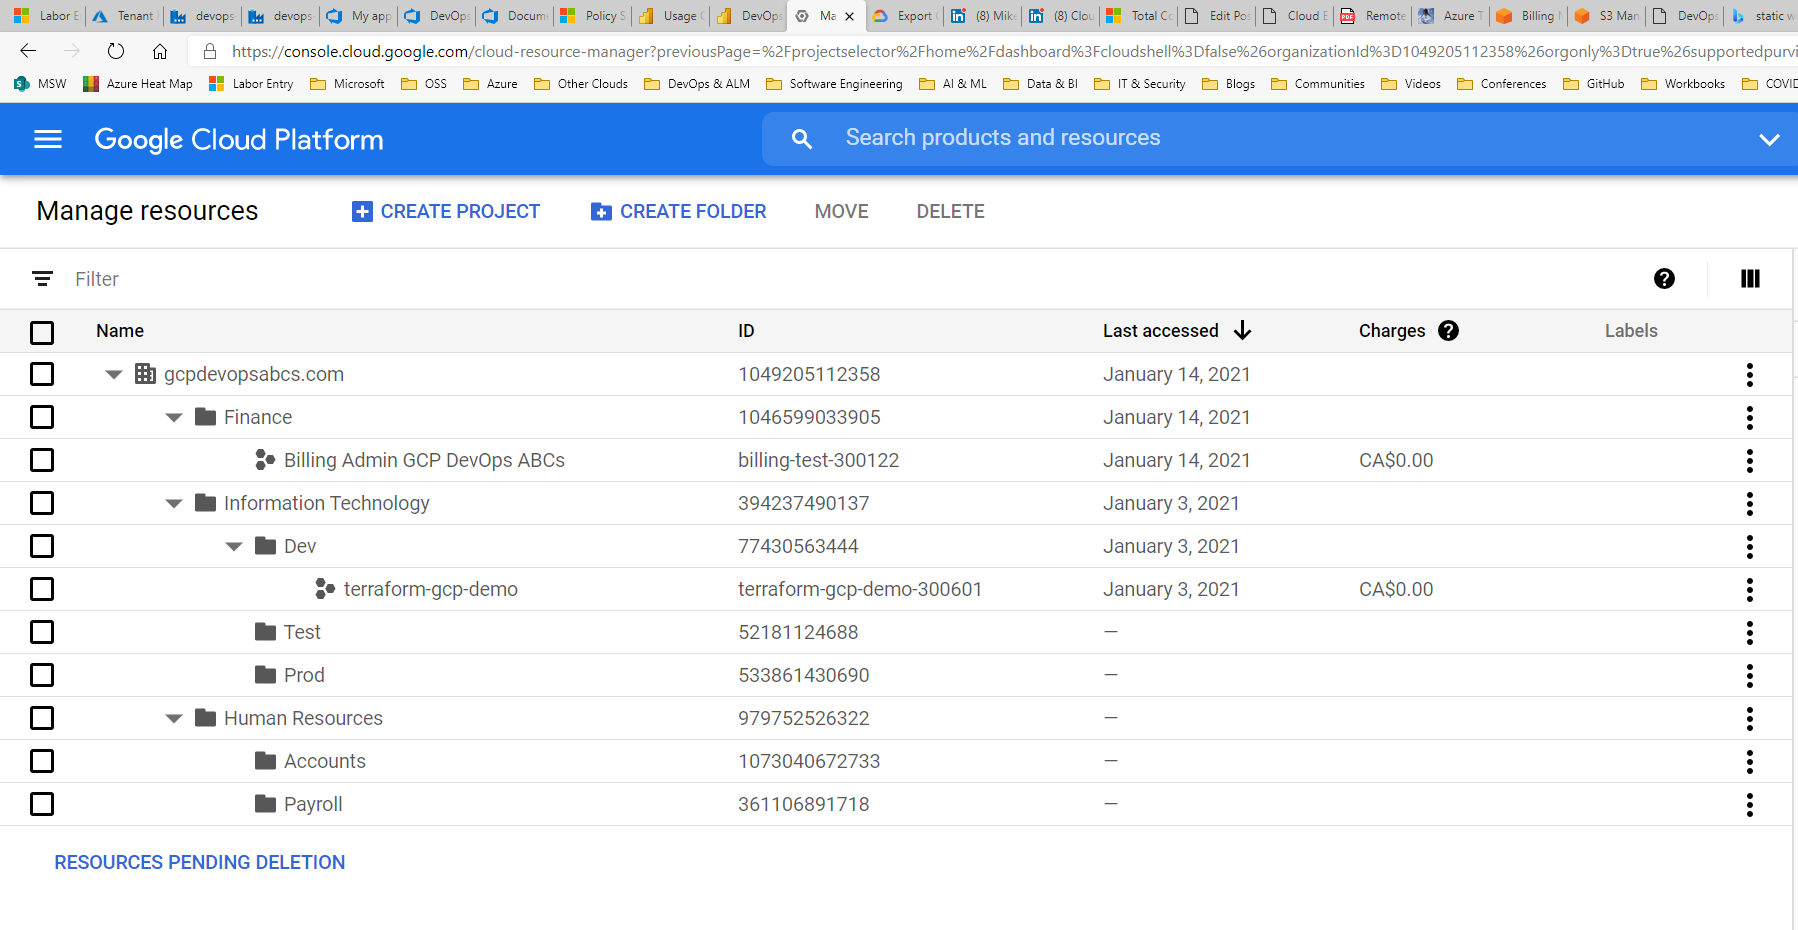
Simple resource hierarchy
From a cost perspective, a Project container for GCP should play the same role as a Resource Group container for Azure. Therefore, the two guiding principles mentioned in the Microsoft Azure section above apply.
The interested reader may find a guide to financial governance in the cloud useful.
Without further ado…
Let us highlight some key pages of the Power BI Comprehensive and Interactive Cost Dashboard.
First, we have a summary for the total Azure cost by Consumed Service (Figure 12). This dashboard can be sliced by Subscription and Resource Group (Figure 13). We recall that we typically measure the cost of a workload for a given environment at the resource group level.

Total Azure Cost by Consumed Service
Total Azure Cost sliced by resource group
We can view the full history of Azure costs by year and subscription (Figure 14).

Cost by Year and Subscription
AWS Costs can be monitored in the following screen:
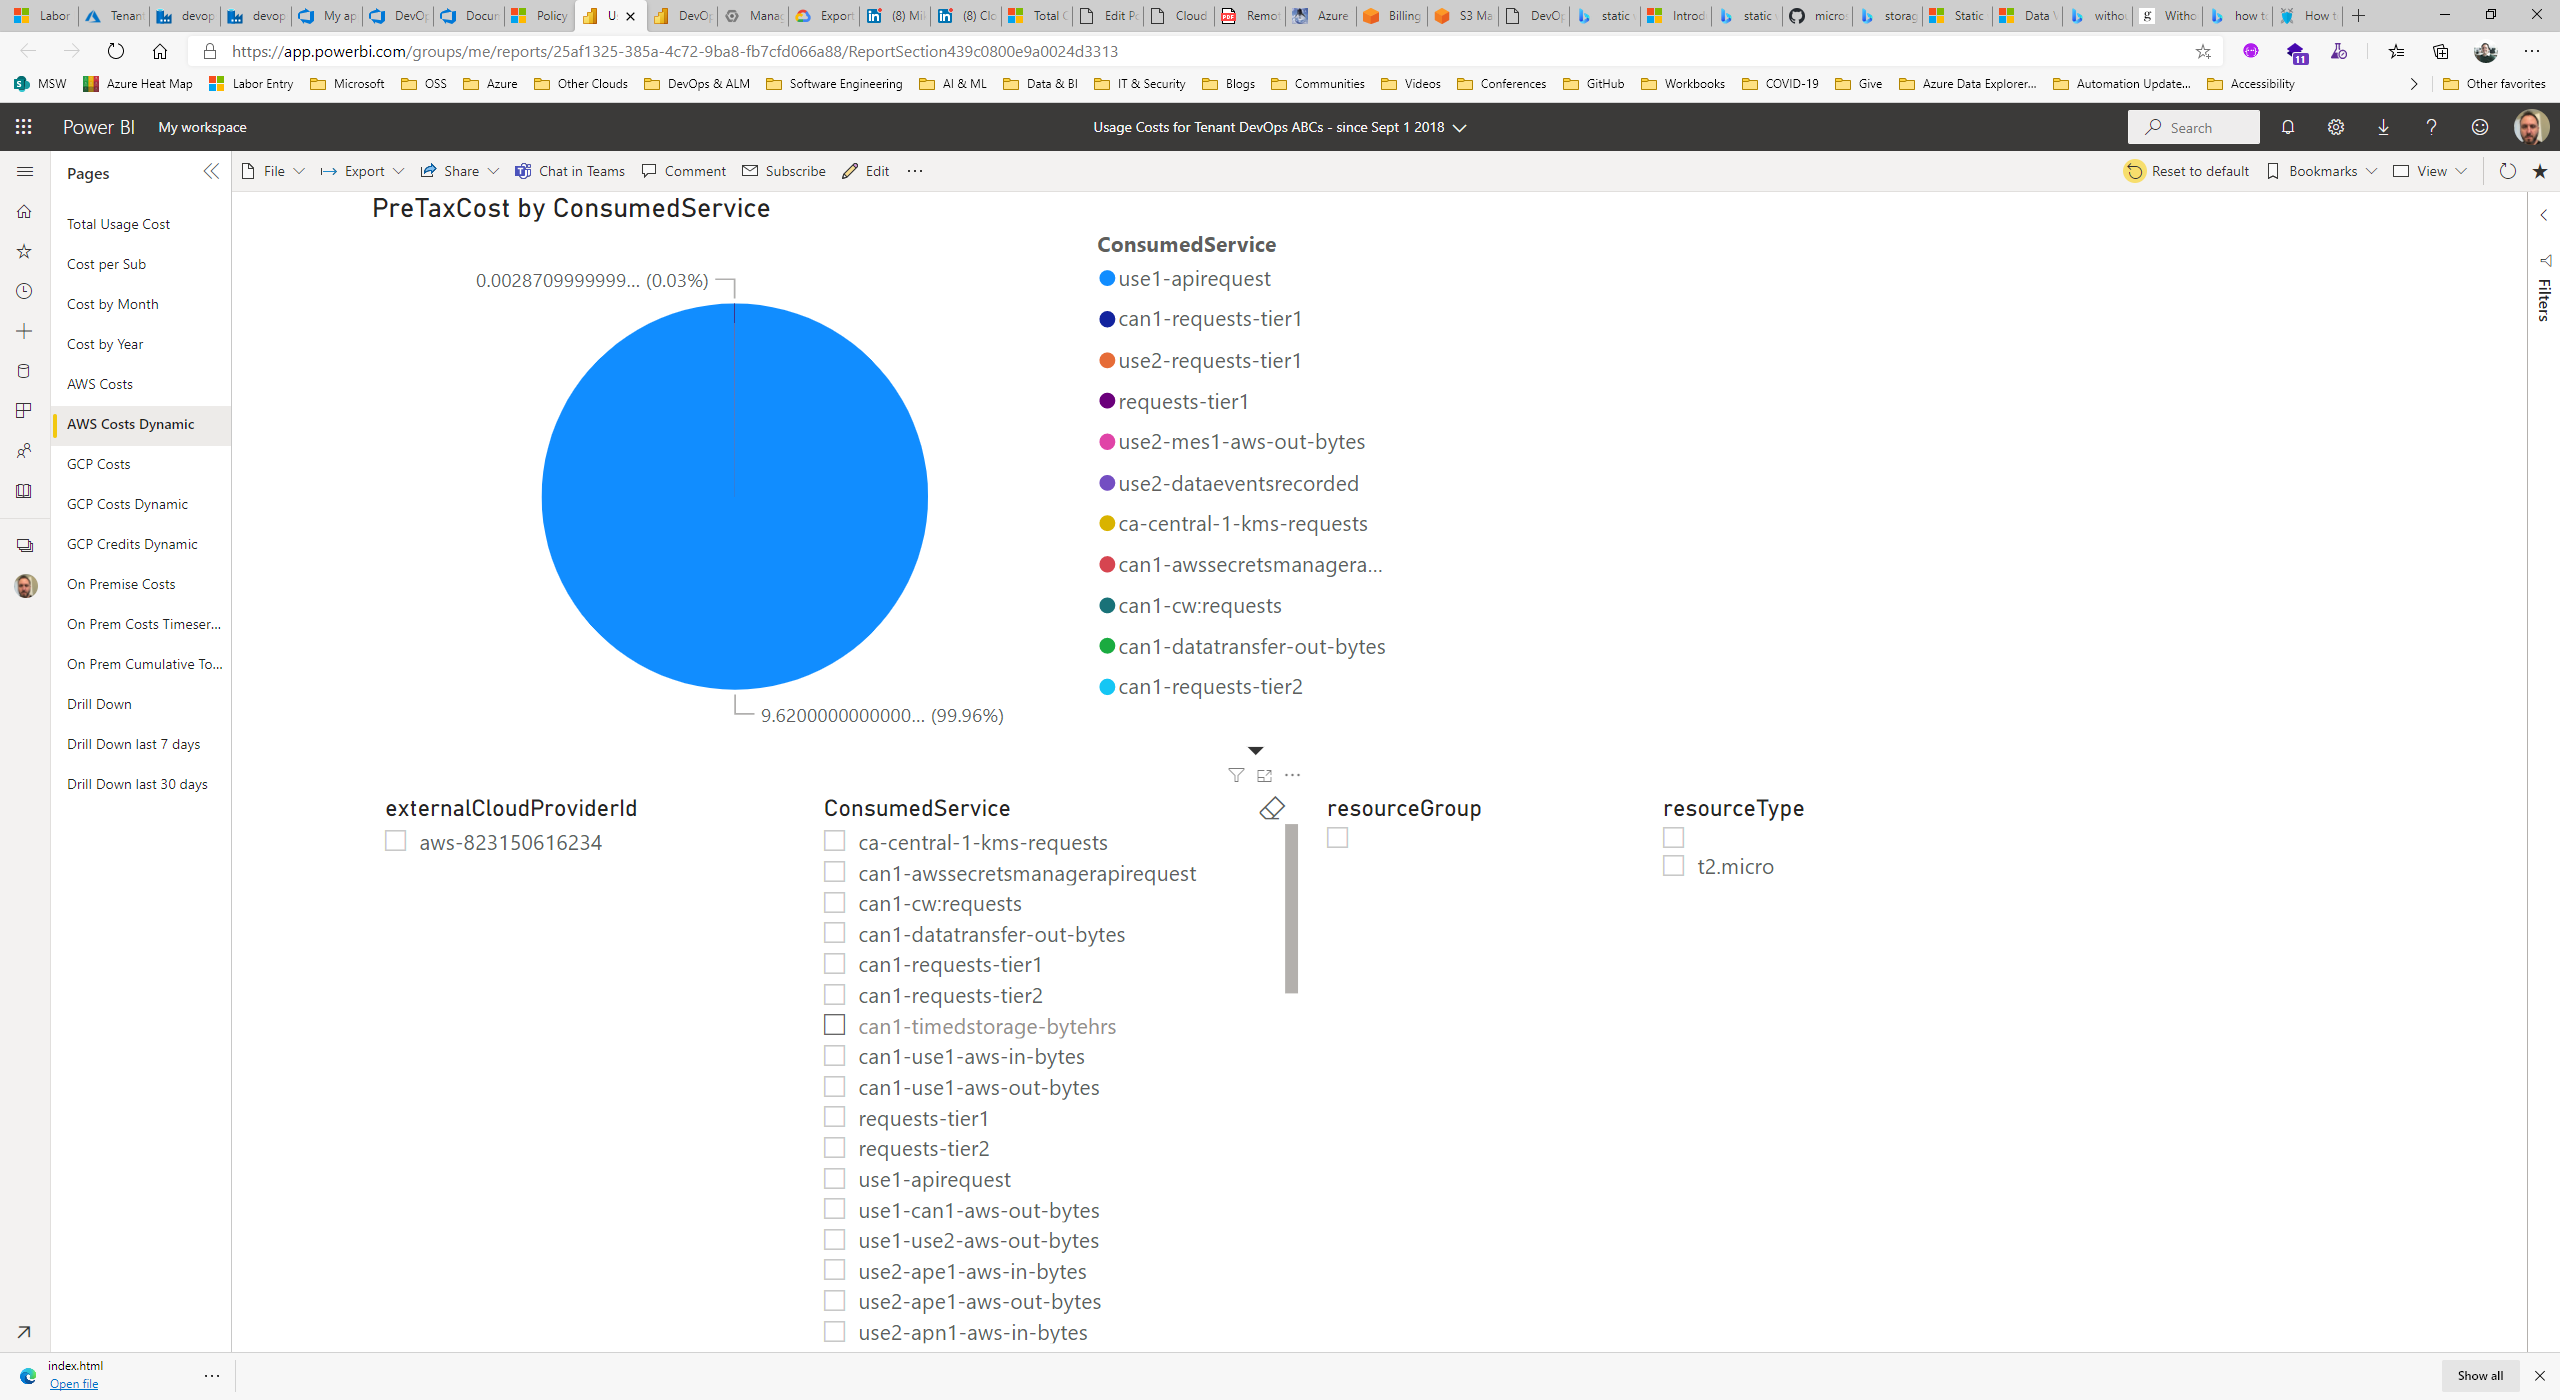
AWS Costs by Consumed Service
Sliced by AWS Billing Account, Consumed Service, and Resource Type
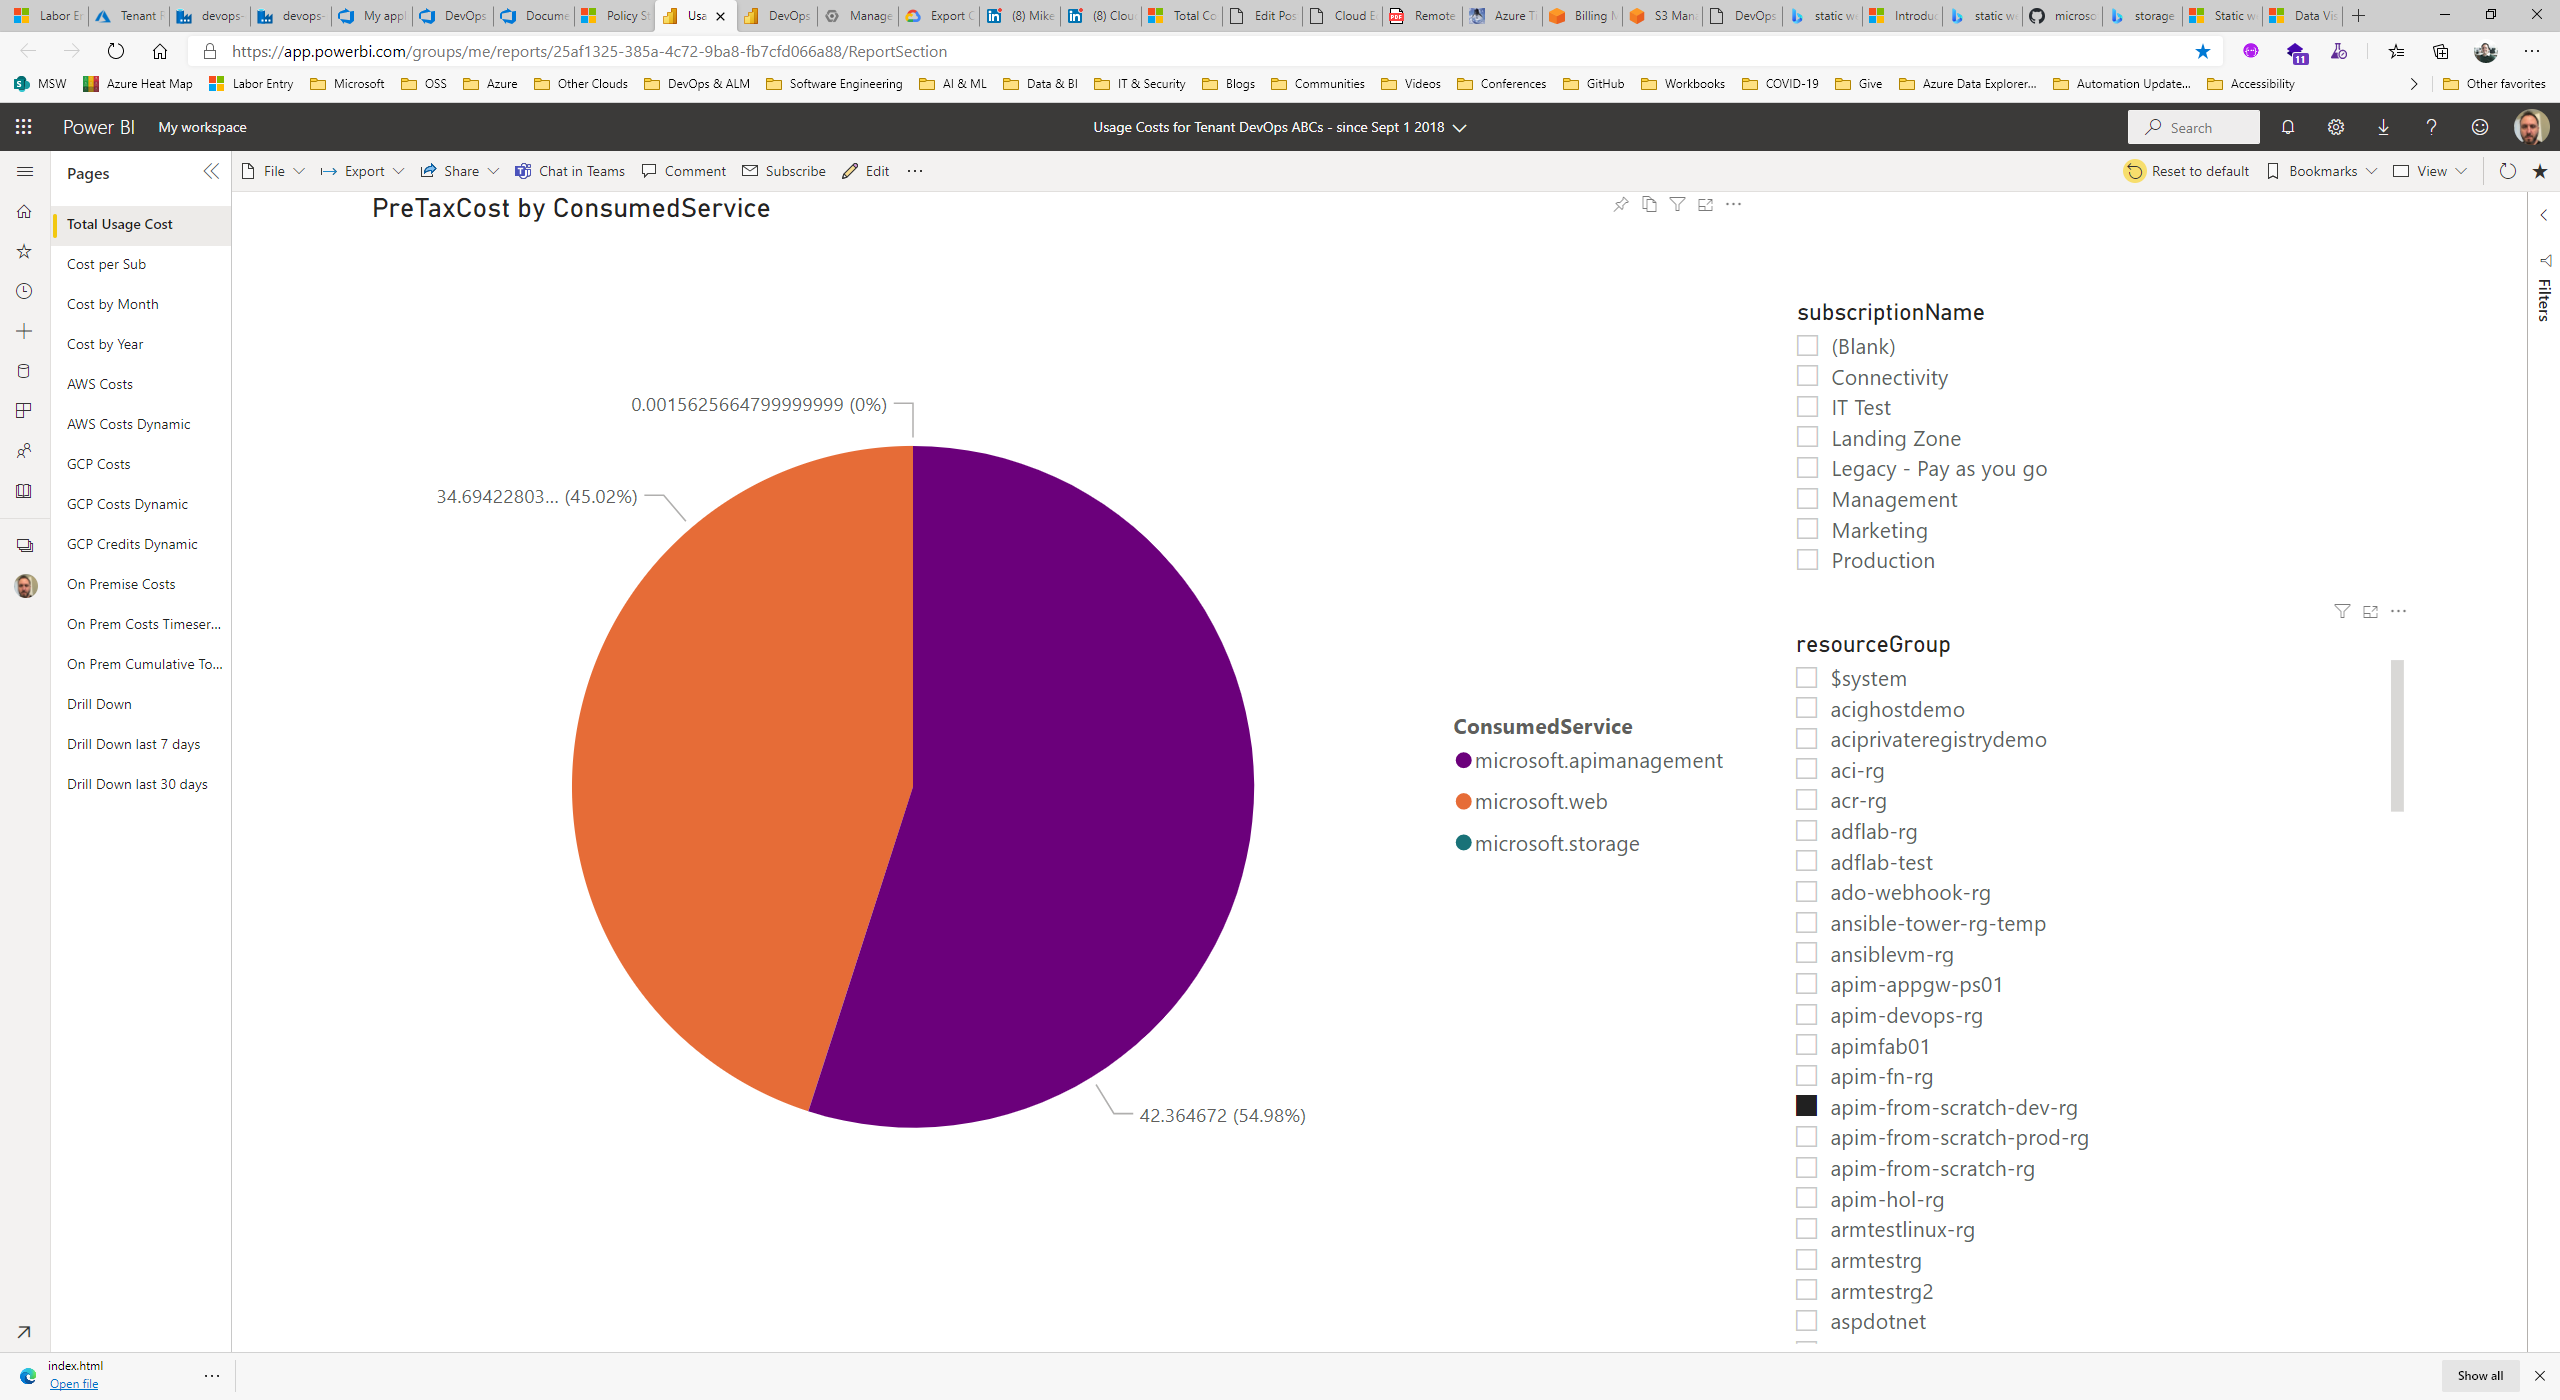
As for GCP costs by service:
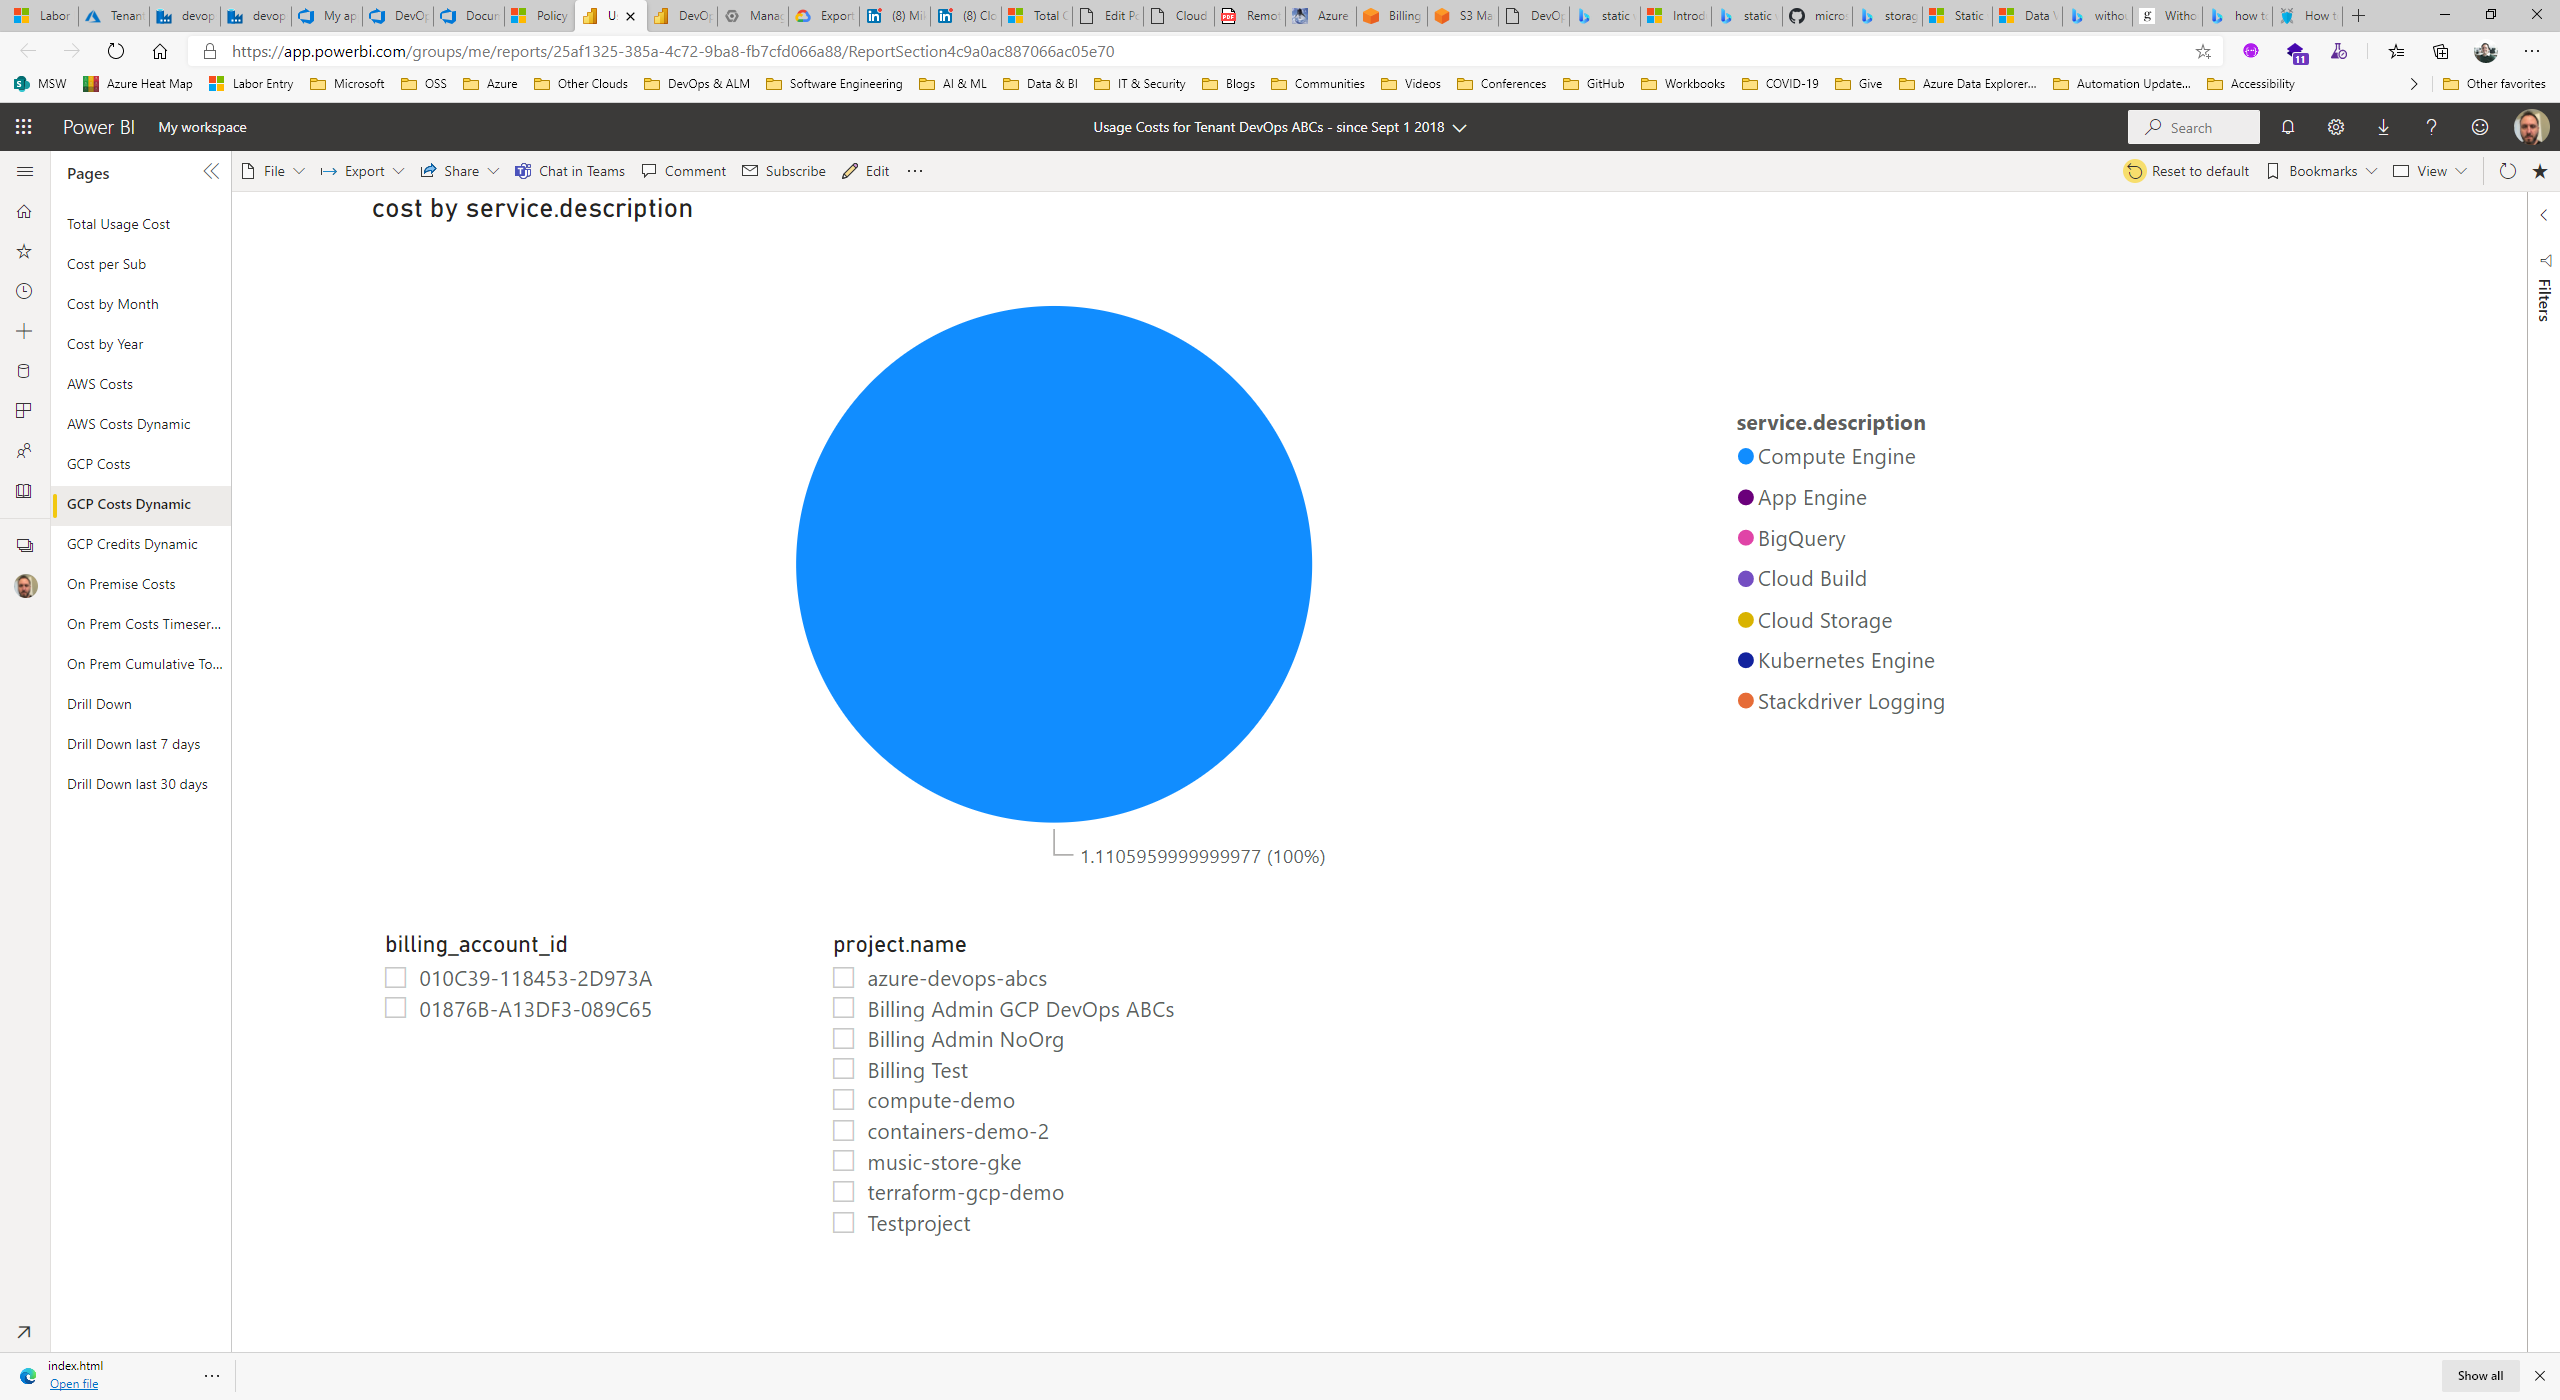
GCP Costs by Service
Sliced by Billing Account and Project
Last, but not least, we need to track on premise costs. To this end, we use the following excel file inspired by the Microsoft Total Cost of Ownership (TCO) Calculator.
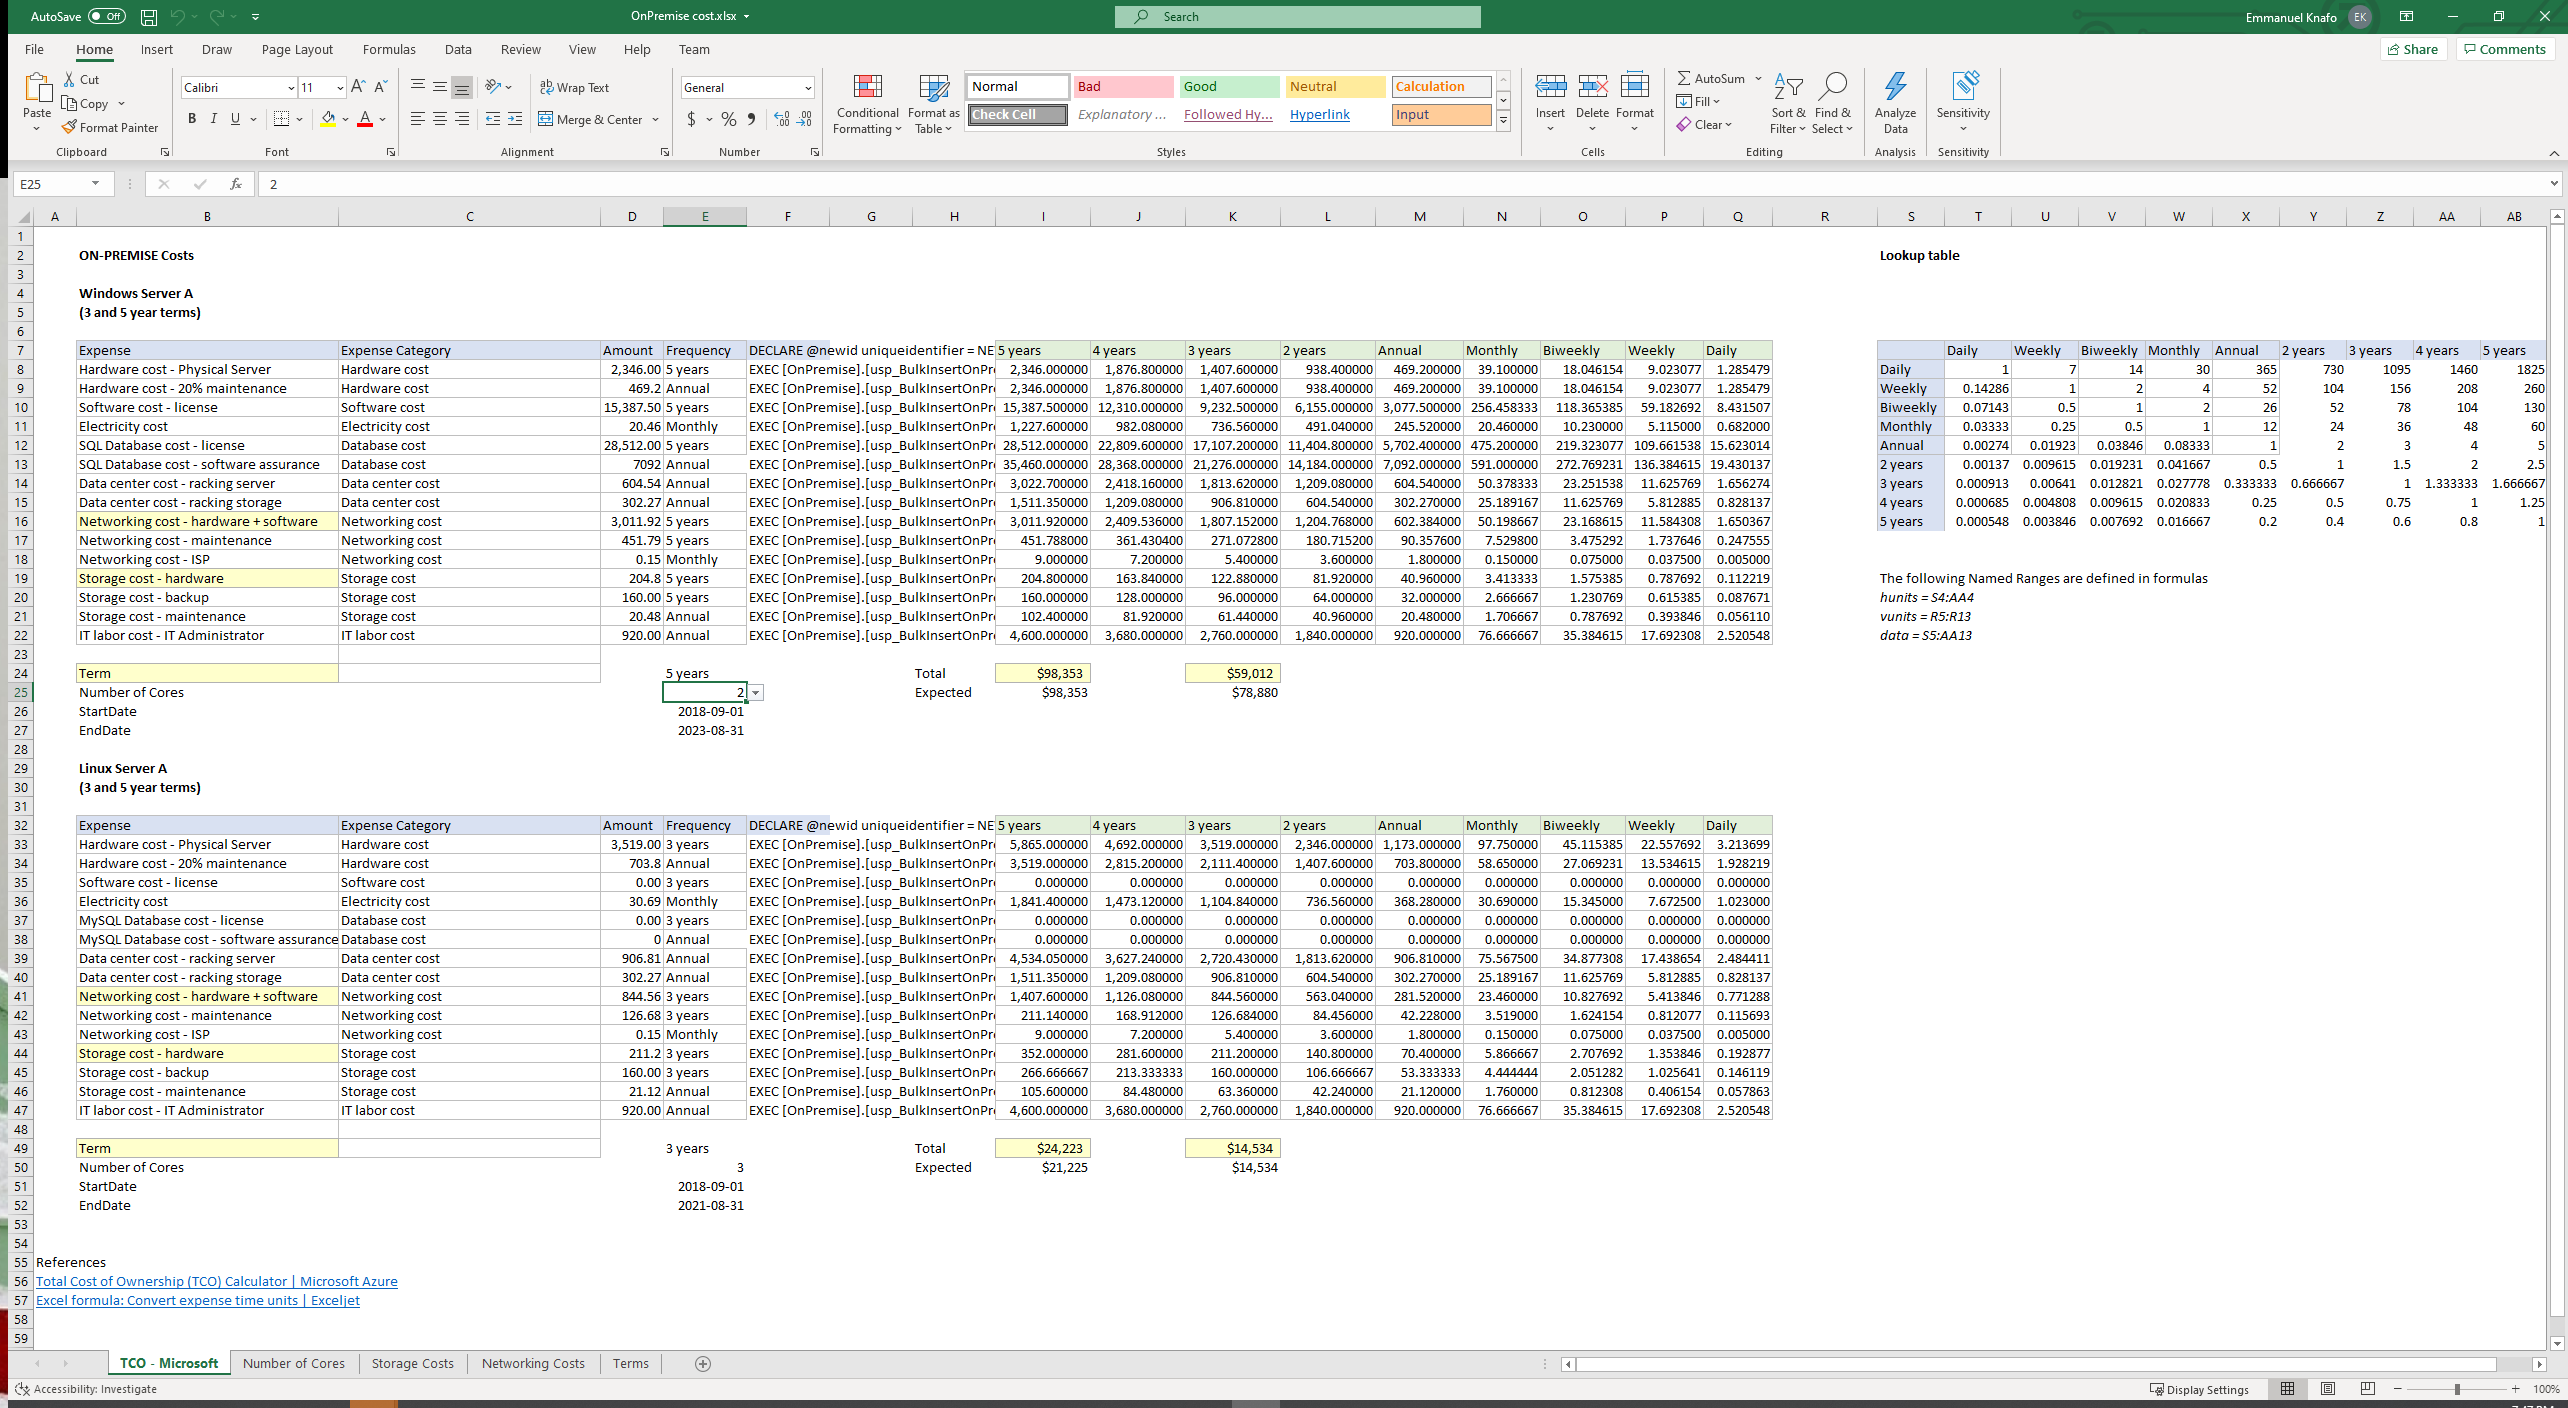
Excel sheet used to calculate and populate daily costs
The On-premise costs can be monitored by expense category and sliced by physical server (Figures 18 and 19).
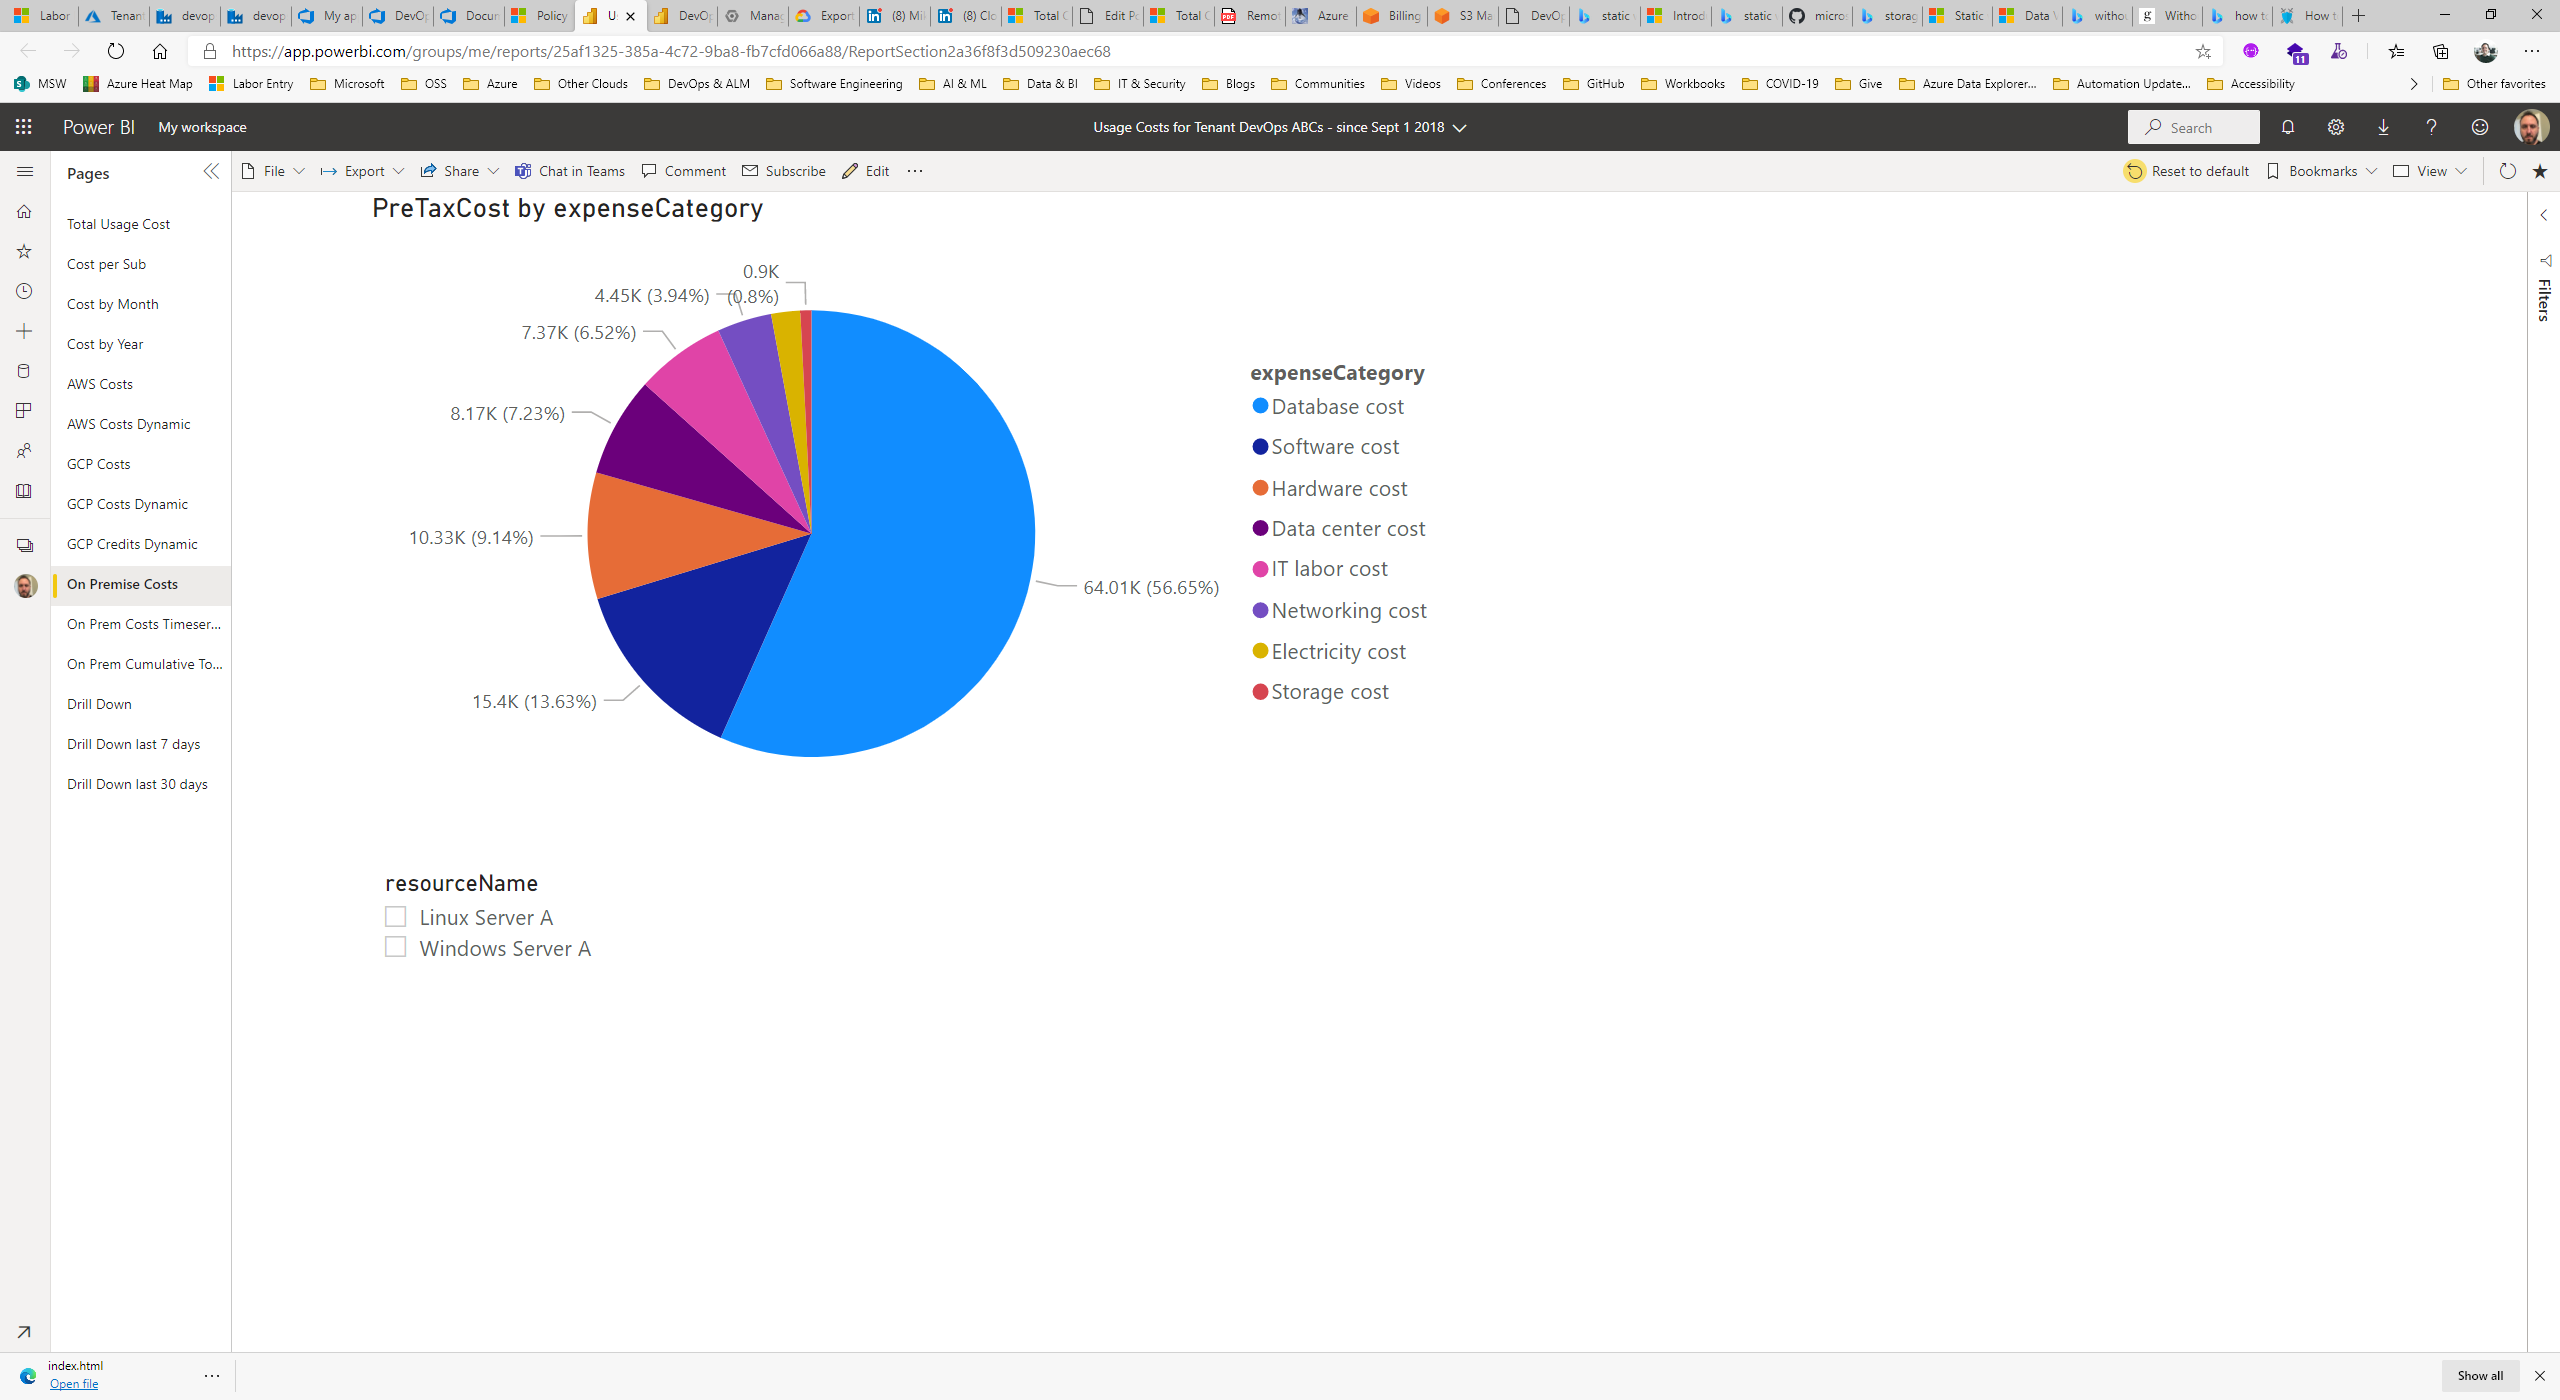
On premise costs by expense category
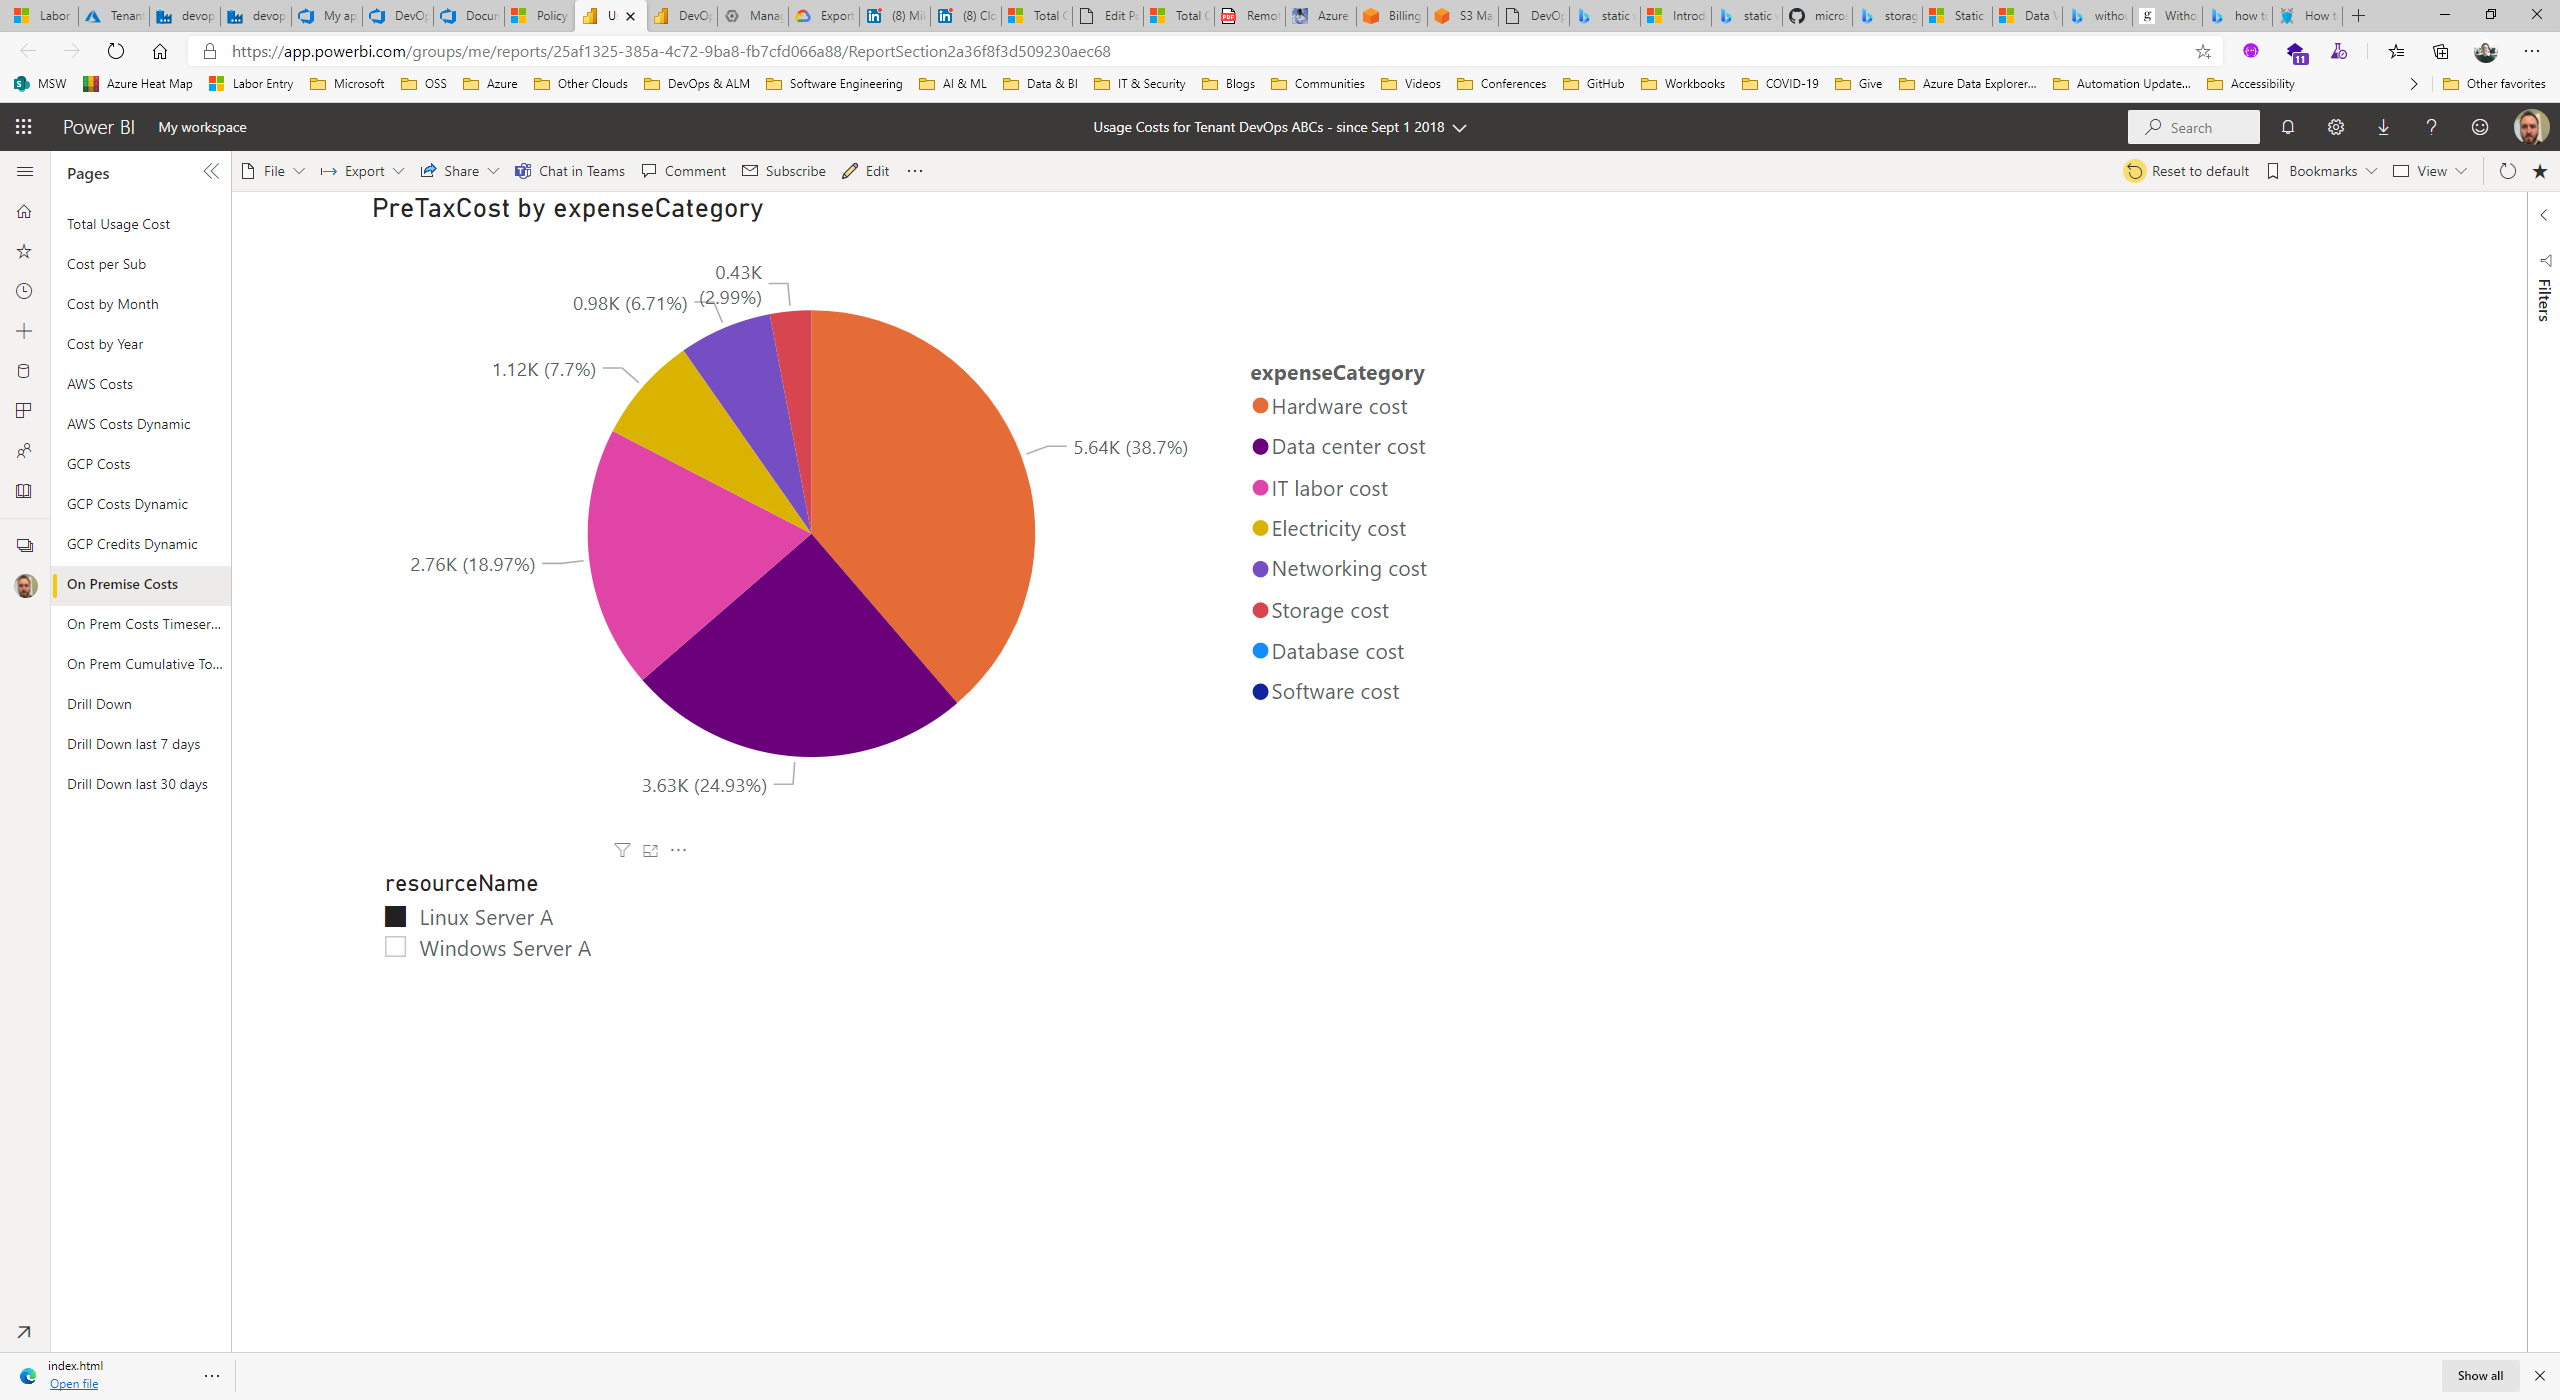
Costs for Linux Server A by expense category
Finally we can look at amortized on-premise costs as in Figure 20.
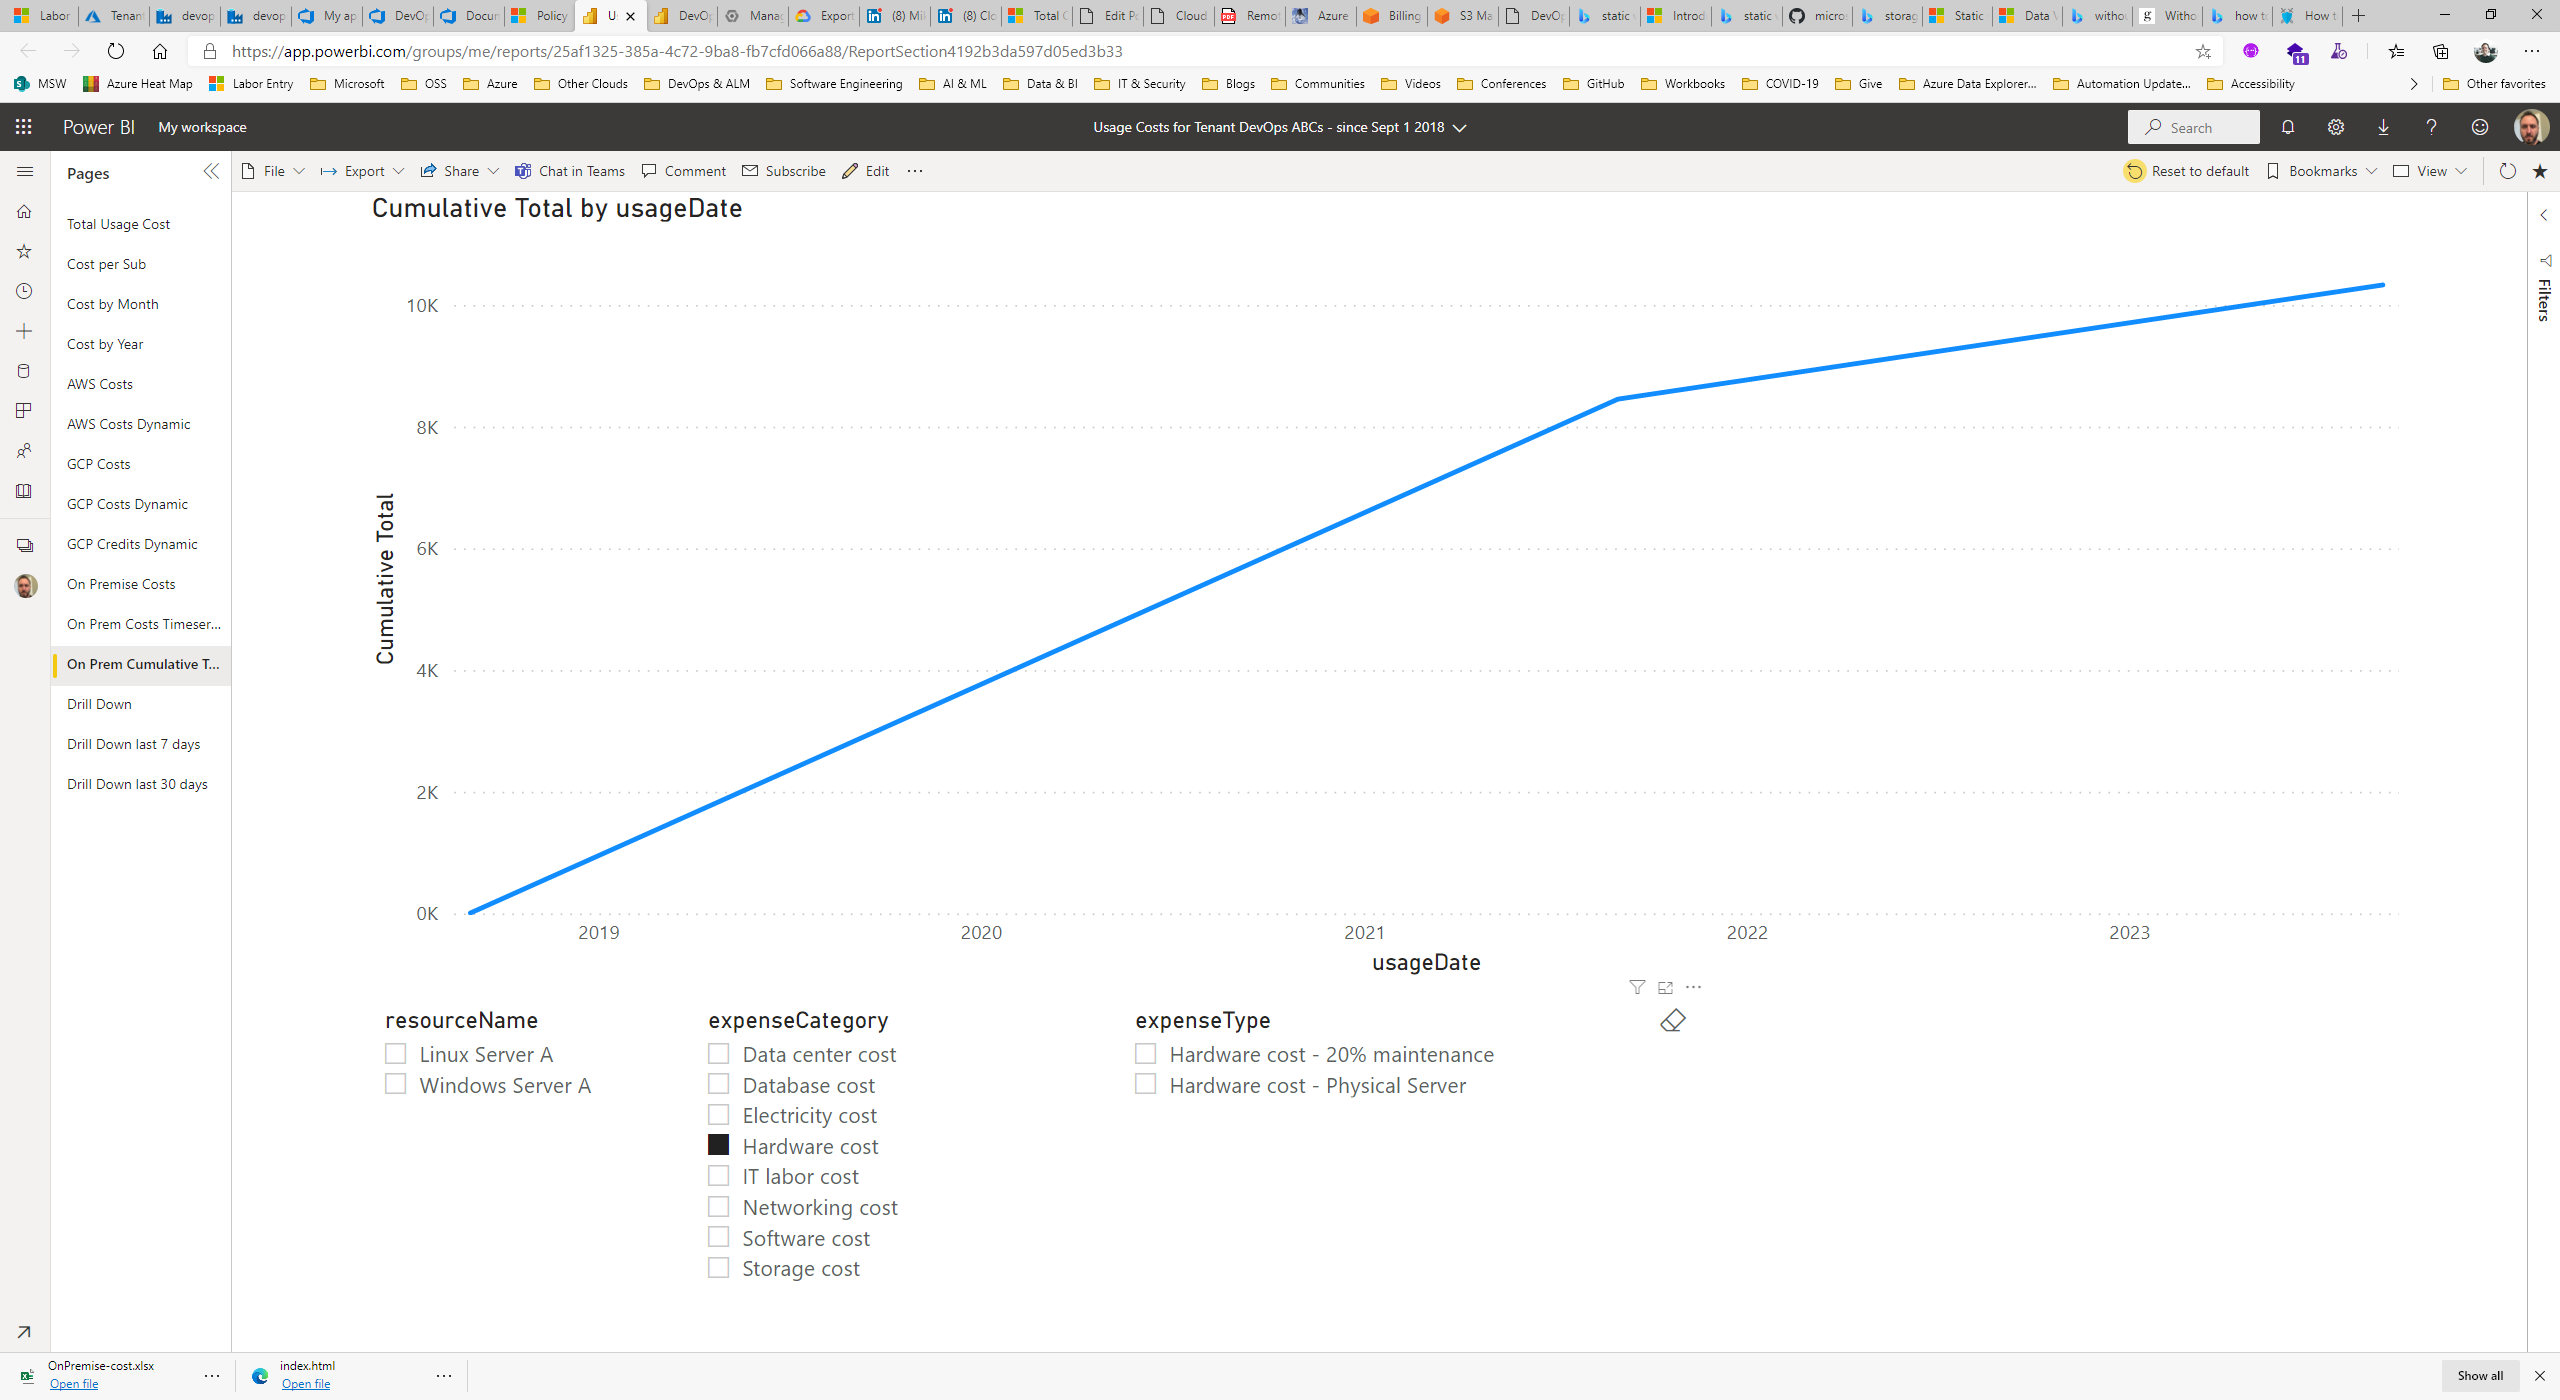
Amortized On-premise Hardware costs
Observe that the marginal cost changes on September 1st, 2021. This is because the Linux Server A is fully paid on that date from an accounting point of view.
What’s my Return on Investment?
OK Emmanuel, nice colorful charts… But what am I getting for my money?
The Boss
Collecting the usage and cost data for all resources, in near real time, no matter where they’re deployed, is only the beginning. The benefits that ensue are:
- Capability of “Shifting Left” Cost Estimation and Optimization when exploring, architecting, and implementing a software solution iteratively
- Cost Anomaly Detection in near-real time (see Figure 21)
- Accurate and predictable budget forecasting especially when comparing similarly sized projects implemented in a similar fashion
- When combined with performance metrics, more accurate Price-Performance ratios
- Better alignment of cloud pricing models to the various workloads (see “The Future of Data & Analytics is in the Cloud” by Adam Ronthal)
- Calculate and forecast migration costs and Total Cost of Ownership (TCO) more accurately
- Better controls on financial governance
- Begin your journey in FinOps!
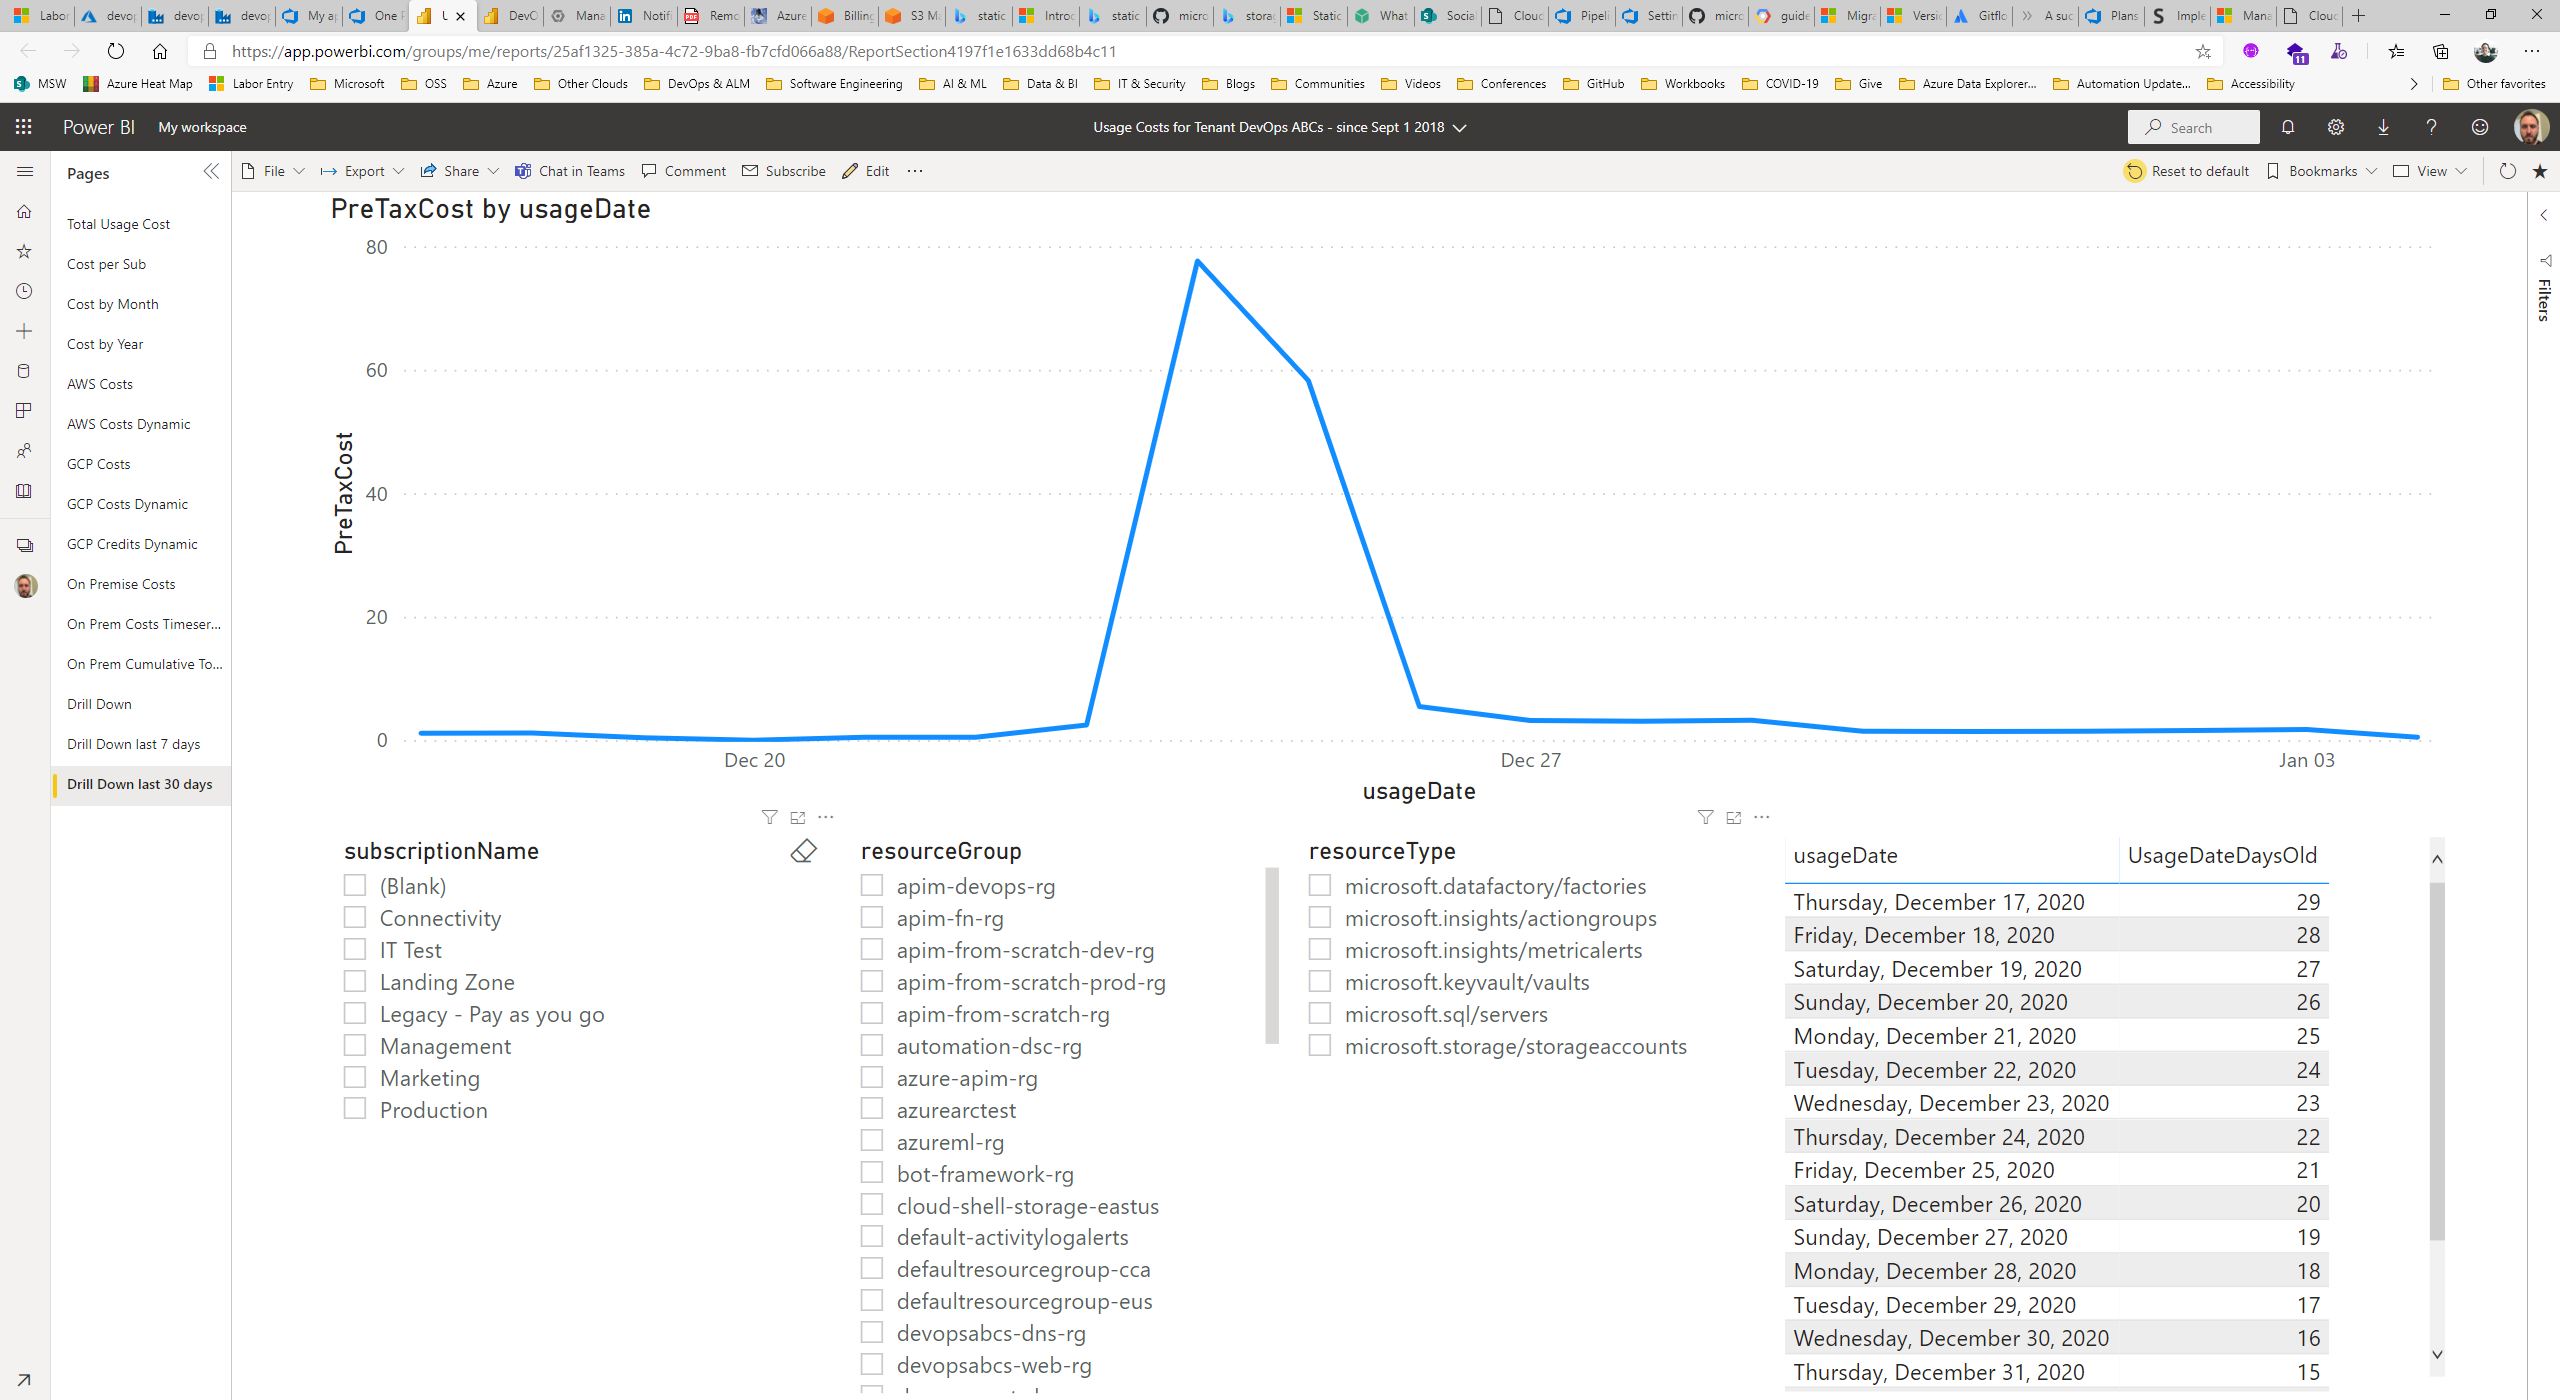
Sample Cost Anomaly
Next Steps
Hopefully, you’re convinced on the value of collecting the usage and cost data for all resources, in near real time, no matter where they’re deployed.
To start off on the right foot:
- Start with a proper governance review – ensure you’re grouping or tagging resources early in alignment with your corporate and financial governance
- Start collecting and warehousing cost and usage data now! Early and inaccurate feedback is better than no feedback at all! Like any other process, it’s iterative. Finally many CSPs do not allow you to collect data retroactively
- Bring everyone impacted early to the table